
Figures & data
Figure 1. Giemsa-stained PCC showing 46 single chromatid chromosomes in non-irradiated G0-peripheral blood lymphocyte (A). Sixteen fragments in excess of 46 PCC can be visualized in an irradiated lymphocyte with 4 Gy when analyzed shortly after exposure (B).
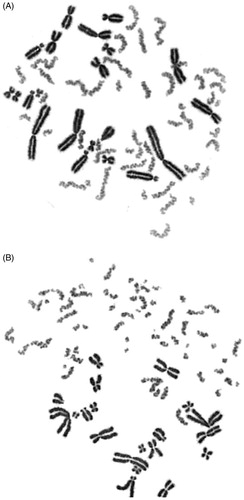
Figure 2. Comparative results obtained from the analysis of gamma-rays induced excess PCC fragments in human lymphocytes for the construction of ‘immediate’ dose-response curves. (Mean curve in black bold line: linear, α = 3.9 ± 0.13 and β = −0.12.) Same 10 digitally captured PCC images per dose-point were sent to and scored by each laboratory [L0 and L1 one scorer each; L3 two scorers, and L5 three scorers].
![Figure 2. Comparative results obtained from the analysis of gamma-rays induced excess PCC fragments in human lymphocytes for the construction of ‘immediate’ dose-response curves. (Mean curve in black bold line: linear, α = 3.9 ± 0.13 and β = −0.12.) Same 10 digitally captured PCC images per dose-point were sent to and scored by each laboratory [L0 and L1 one scorer each; L3 two scorers, and L5 three scorers].](/cms/asset/ab1db078-ee6a-4002-9c53-72ee682da084/irab_a_1234725_f0002_b.jpg)
Table 1. Dose assessments (in vitro)Table Footnotea obtained by the analysis of 20 lymphocyte PCC spreads per coded slide by each laboratory group.
Figure 3. Gamma-rays induced fragments in excess of 46 PCC following irradiation to doses up to 6 Gy. (Mean curve in black bold line: linear, α = 3.3 ± 0.16 and β = −0.26) Sets of coded replicate slides were sent to and analysed by each laboratory.
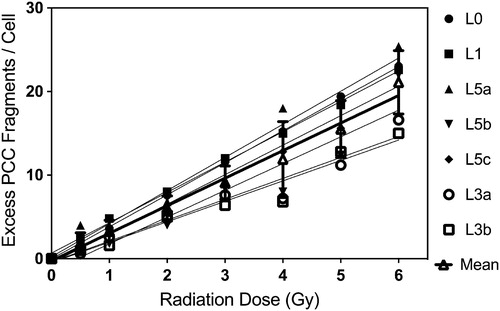
Table 2. Estimation of the fraction of damaged/undamaged cells using the PCC assay in human lymphocytes exposed to gamma-rays and mixed with unirradiated lymphocytes (1:1).
Figure 4. Dose-response curve for excess lymphocyte PCC fragments at 24 h post-irradiation repair time and for doses up to 9 Gy (Linear, α = 1.2 ± 0.029 β = −0.082). Mean values ± SD are calculated from three independent experiments.
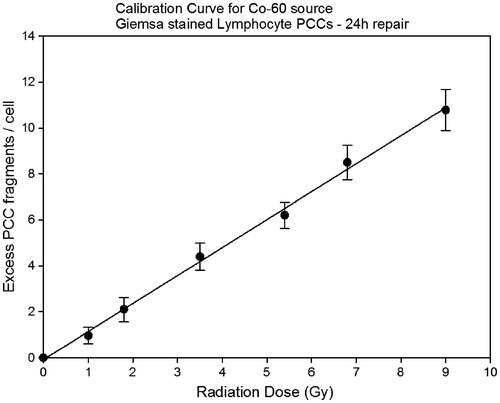
Table 3. Dose estimates obtained by each participating laboratory for samples Re5a, Re5b (0.85 Gy) on the basis of the yield of Giemsa-stained excess PCC fragments/cell using the calibration curve for 24-h repair period at 37 °C constructed by Lab L1. Lab L6 used its own calibration curve.
Table 4. Dose estimates obtained by each participating laboratory for samples Re6a, Re6b (2.7 Gy) on the basis of the yield of Giemsa-stained excess PCC fragments/cell using the calibration curve for 24-h repair period at 37 °C constructed by Lab L1. Lab L6 used its own calibration curve.
Figure 5. Z-scores for estimated doses based on 30–40 cells from samples Re5a and Re5b. Dashed lines indicate boundaries of classification according to z-scores.
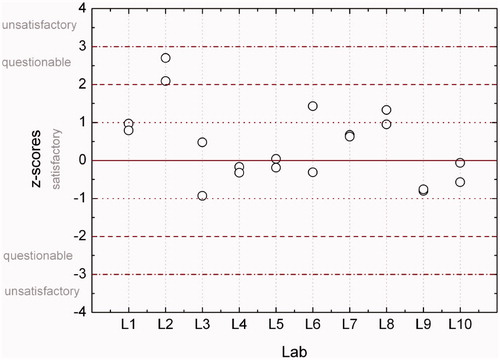
Figure 6. Z-scores for estimated doses based on 30–40 cells from samples Re6a and Re6b. Dashed lines indicate boundaries of classification according to z-scores.
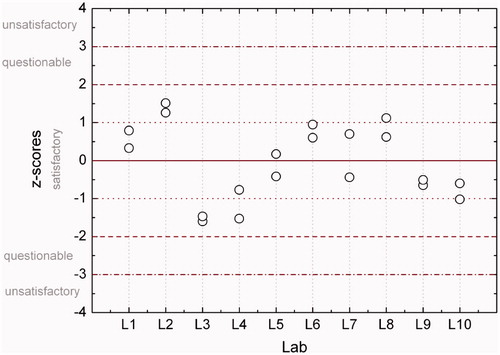
Figure 7. G0-lymphocyte PCC visualized by means of inverted grey scale mode (ISIS-FISH software, MetaSystems) following a 24 h post-irradiation repair period showing two possible dicentric chromosomes (A). True dicentric chromosomes (T dic) can be detected accurately only by means of C/T FISH staining with PNA probes (B). The presence of telomeric staining (Tel-FAM, green) between the two centromeres (Cent-Cy3, red), as shown in this Figure (B), confirms undoubtedly a false dicentric (F dic).
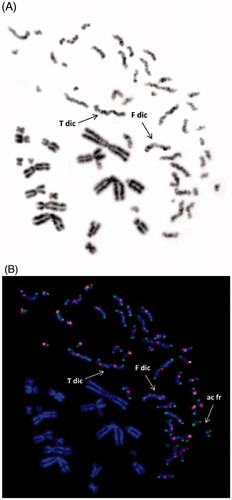
Table 5. Dose estimates obtained by three participating laboratories (L1, L2 and L6) based on dicentric analysis in G0-lymphocyte PCC, using centromere-telomere staining with peptide nucleic acid (PNA) probes, for both samples Re5 (0.85 Gy) and Re6 (2.7 Gy).