
Figures & data
Figure 1. Establishment of the FHC Biobank. (a) Milestones of the administrative process are shown over the time scale, including the authorization required from the French research ministry (CCTIRS, Agreement no. 11.700, 11 Dec 2011) and the National Commission on Informatics and Liberty (CNIL, Agreement no. 912.039, 10 Jan 2012), and major steps during the process of patient acquisition and progress in biobanking are shown underneath. (b) Black square: Follow-up and general information about the FHC. Blue square: Description of participation and the outcome of the establishment of the FHC biobank. (c) Categorization of exposed donors in the FHC biobank into dose groups based on the mean dose received by the bone marrow. Gender and age-distribution in the FHC biobank within the different dose groups. (d) Detailed information about the cancer cases (19 new cancer cases present among the 369 donors of the FHC biobank) and donors with cardiovascular diseases (nine in total, among them three with cancer) within the FHC biobank.
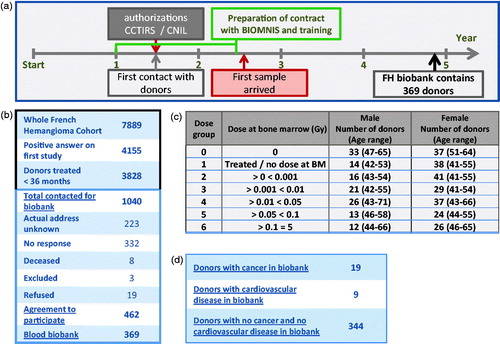
Figure 2. Characterization of the FHC Biobank. (a) Visualization of the age range at the time of blood donation (red) relative to the age at the time of exposure during treatment for hemangioma (blue). (b) Allocation and proportion per body region of bone marrow in a 1-year-old child.
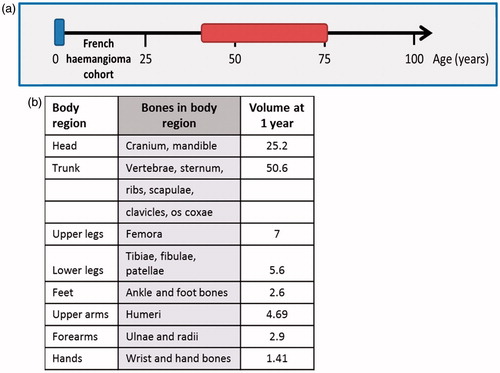
Figure 3. Overall mean Telomere Length in non-exposed vs. exposed Individuals. (a) Images of individual nuclei of T-lymphocytes used to measure mean telomere length by Q-FISH and quantification of the entire telomere signal (Cy3, red signal). (b) Calibration curve using the four different cell lines (REMB, HW19, HW18, HT1080) of known telomere lengths used to compare different experiments and translate the relative telomere length by fluorescent signal into telomere length in kb. (c) Distribution of mean telomere length in T-lymphocytes in exposed vs. non-exposed donors and (d) within the different dose groups.
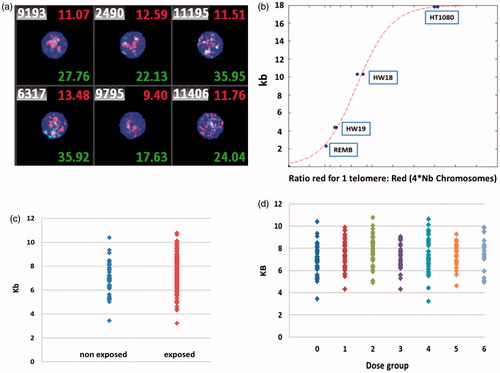
Figure 4. Mean Telomere Length in non-exposed vs. exposed Donors. Mean telomere length as a function of age in non-exposed (a) and exposed (b) donors versus the curve of Vaziri et al. (Citation1993). (c) Table showing the results of model 1. (d) Visualization of mean telomere length as a function of the dose and the age for all donors. The estimated surface of model 1 (middle) is represented with its confidence bands (lower and upper). (e) Color-coded plot of mean telomere length (red represents long telomeres and blue short telomeres) against the age of the donor and the mean dose received by the bone marrow.
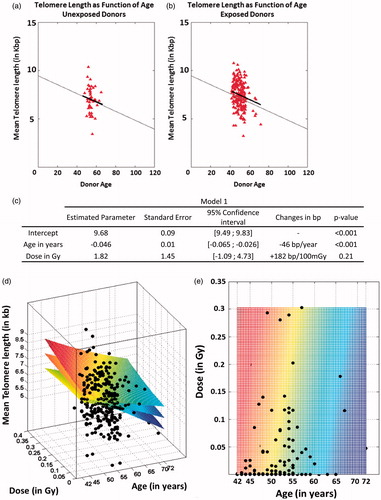
Figure 5. Mean telomere length as a function of age and the mean dose received by the bone marrow. (a) Examples of dose-distribution quantile functions after radiotherapy for skin hemangioma (mean doses in legend). (b) Distribution of intra-individual telomere length in all donors of the FHC biobank (red = exposed donors, green = non-exposed donors). (c) Predicted telomere length distribution for unexposed individuals of various ages using model 2. (d) Telomere length distribution at 50 years of age as a function of the mean dose received. (e) Correlation of telomere and dose quantile distribution (red indicates an increase in the frequency of larger telomeres; blue indicates an increase in the frequency of shorter telomeres). (f) Dose effect as a projection of the surface coefficient (model 3).
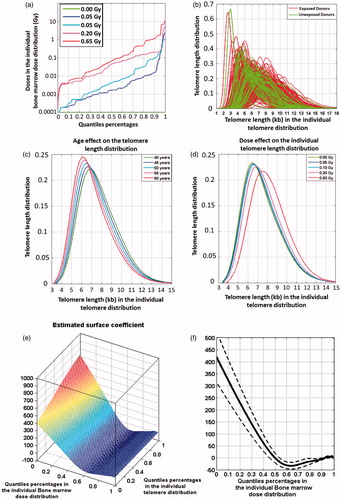
Table 1. Summary of results obtained for models 2 and 3 fit.