Figures & data
Table 1. Effect of BP-C2 on the outcome of acute radiation injuries in CBA mice.
Figure 1. Effect of BP-C2 on survival of CBA mice after TBI. BP-C2 or Placebo were given by gavage 5 times every second day prior to, and 5 times every second day after, irradiation. n = 12 animals per group at 5.0 Gy and n = 24 animals per pooled group at 6.0 and 7.0 Gy from two sets of experiments.
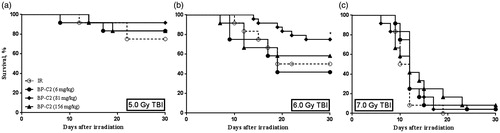
Table 2. Effect of BP-C2 on LD50 doses in CBA mice.
Figure 2. Effect of BP-C2 on weight of spleen and number of CFUs in CBA mice on day 10 after TBI. BP-C2 (81 mg/kg) was given by gavage 5 times every second day prior to, and 5 times every second day after, 5.7 Gy irradiation. (a) Weight of spleen. (b) CFUs. Data are presented as M ± SD. ****p < .0001. n = 12 animals per group.
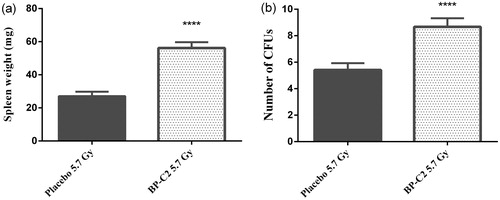
Table 3. Effect of BP-C2 on the survival of C57BL/6 mice on day 8 after total body irradiation.
Figure 3. Effect of BP-C2 on nucleated bone marrow cell count in C57BL/6 mice on day 8 after TBI. BP-C2 (81 mg/kg) was given by gavage daily 7 times starting 24 h after irradiation. Data are presented as M ± SD. ****p < .0001 versus control.
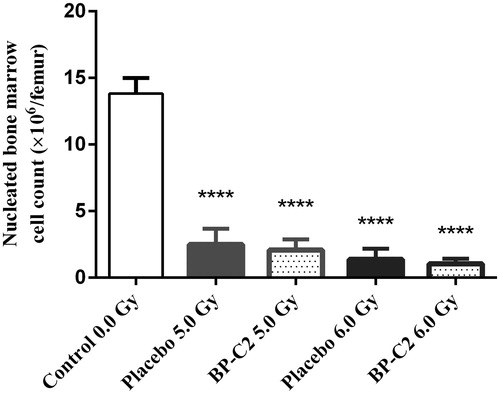
Figure 4. Survival curves for nucleated bone marrow cells. Effect of therapeutic administration of BP-C2 on survival of nucleated bone marrow cells in C57BL/6 mice on day 8 after irradiation. (a) Placebo groups, (b) BP-C2 (81 mg/kg) groups. Dq – quasi-threshold dose representing the cells’ self-repair capacity, n – extrapolation coefficient.
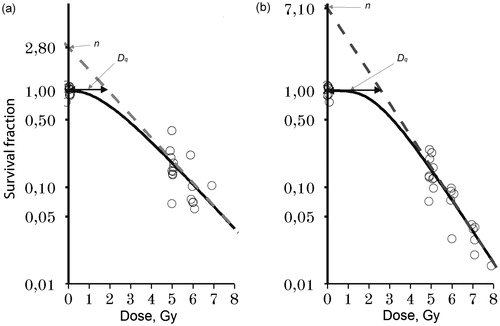
Figure 5. Effect of BP-C2 on weight of spleen and number of CFUs in C57BL/6 mice on day 8 after TBI. BP-C2 (81 mg/kg) was given by gavage daily 7 times starting 24 hours after irradiation. (a) Weight of spleen. (b) CFUs. Data are presented as M ± SD. Control group – 0.0 Gy n = 10; placebo groups – 5.0 Gy n = 10, 6.0 Gy n = 6; BP-C2 groups – 5.0 Gy n = 10, 6.0 Gy n = 5. CFUs: spleen colony-forming units; TBI: total body irradiation; n: number of animals. ****p < .0001 versus control. ***p = .0002 versus Control. #p = .0245 versus placebo 5.0 Gy.
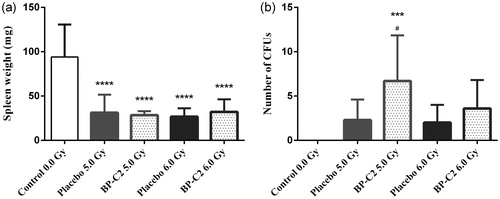
Figure 6. Effect of BP-C2 on number of SIC in C57BL/6 mice on day 8 after TBI. BP-C2 (81 mg/kg) was given by gavage daily starting 24 h after irradiation 7 times. Data are presented as M ± SD. Control group – 0.0 Gy n = 10 (100), placebo groups – 5.0 Gy n = 10 (90), 6.0 Gy n = 6 (60), 7.0 Gy n = 1 (10), BP-C2 groups – 5.0 Gy n = 10 (83), 6.0 Gy n = 5 (48), 7.0 Gy n = 5 (46), 8.0 Gy n = 1 (10). n – number of animals (number of intestinal cross-sections scored). ***, ****p < .001, p < .0001 versus Control. ##p = .0023 BP-C2 5.0 Gy versus placebo 5.0 Gy, ####p < .0001 BP-C2 6.0 Gy versus. placebo 6.0 Gy.
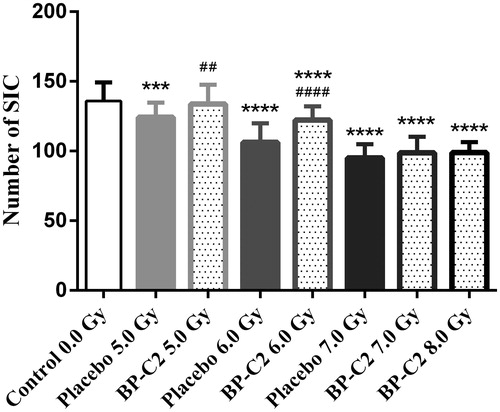
Figure 7. Effect of BP-C2 on Lgr5 + cells of intestinal crypts in C57BL/6 mice on day 8 after TBI. (a) Control 0.0 Gy; (b) Placebo 5.0 Gy; (c) BP-C2 (81 mg/kg) 5.0 Gy; (d) Placebo 7.0 Gy (note marked loss of intestinal crypts along with depletion of Lgr5 + cells); (e) BP-C2 (81 mg/kg) 7.0 Gy; (f) Number of Lgr5 + cells of intestinal crypts (data are presented as M ± SEM). **p < .01, ****p < .0001 versus Control, ###p < .001, ####p < .0001 BP-C2 group versus placebo group. Scale bar – 500 μm.
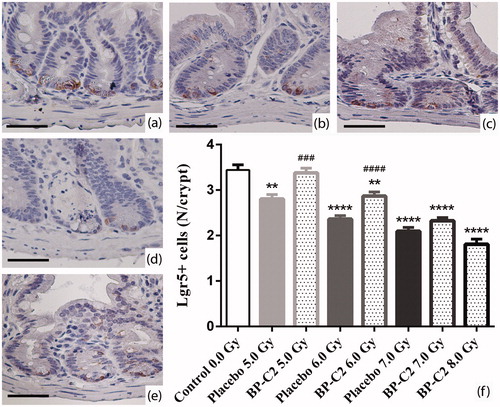
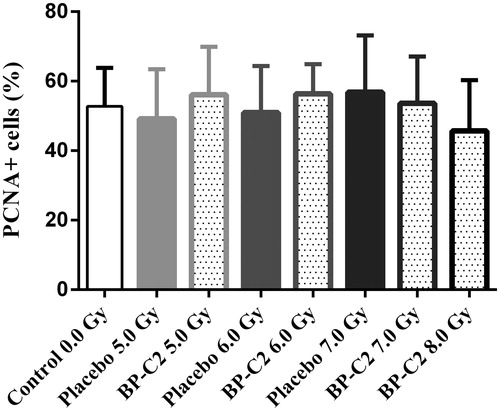
Figure 8. PCNA + cells of intestinal crypts in C57BL/6 mice on day 8 after TBI. BP-C2 (81 mg/kg) was given by gavage daily 7 times starting 24 hours after irradiation. Data are presented as M ± SD.