Figures & data
Figure 1. The model of mitochondrial DNA (mtDNA) and mitochondria in PARTRAC in a perspective view by POV-Ray™ (Persistence of Vision Raytracer Pty. Ltd., Victoria, Australia) raytracer software. (A) Basic 15 nm box used as a building brick of the mtDNA model. The DNA double helix is represented in atomic resolution. The TFAM proteins are not modelled explicitly in atomic resolution but as bending regions of the mtDNA only. The straight box shown here contains 326 bp of mtDNA and eight U-turns around TFAM proteins. (B) The model of a single mtDNA molecule is obtained by seamlessly stacking 52 basic boxes (20 straight and 32 bent ones). The whole 16.7 kbp closed loop is compacted into a nucleoid fitting into a cube with 80 nm side length. (C) 1000 mitochondria (yellow), with 10 mtDNA nucleoids each, are placed randomly in the cytoplasm of a model cell around the spherical nucleus (blue, with shadows from the nucleoids). The nucleus contains a multi-scale model of nuclear DNA (not depicted here) that ranges from DNA double helix in atomic resolution over nucleosomes, 30 nm chromatin fiber, and chromatin domains to chromosomes, as described in detail previously (Friedland et al. Citation2011a).
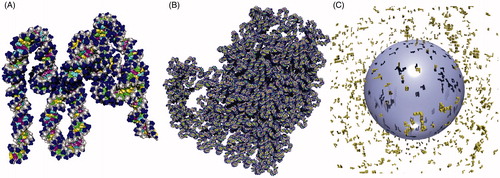
Figure 2. Cumulative distribution of specific energies (‘local doses’) deposited to 0.5 µm3 mitochondria (solid lines) or 125 µm3 cell nuclei (dotted lines) by 2 mGy (red), 20 mGy (green), 0.2 Gy (cyan) or 2 Gy (black) of 60Co γ-ray irradiation. To present the targets receiving low (or not at all) as well as those receiving high specific energies, the same results are plotted twice: (A) Fraction of mitochondria and cell nuclei with specific energies below the abscissa values. Since a single hit to a mitochondrion translates into specific energy of 4.8 mGy, the leftmost segments of the histograms depict the fraction of non-hit mitochondria. (B) Fraction of mitochondria and cell nuclei with specific energies above the abscissa values. The leftmost segments refer to the fraction of hit mitochondria.
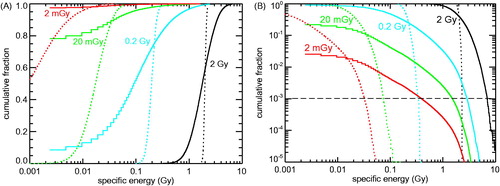
Figure 3. Cumulative distribution of specific energies in mitochondria and cell nuclei due to 5 MeV α-particle irradiation. Solid lines: results for mitochondria (0.5 µm³ volume), dotted lines: results for cell nuclei (125 µm³ volume); red: single particles that have hit the target volume, black: 1 Gy dose (fluence: 0.061 µm−2). (A) Fraction of mitochondria or cell nuclei with specific energies below the abscissa values. (B) Fraction of mitochondria or cell nuclei with specific energies above the abscissa values.
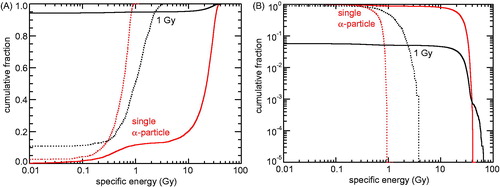
Table 1. Radiation-induced yields of damage to nuclear and mitochondrial DNA (nDNA and mtDNA, respectively) predicted by PARTRAC simulations.
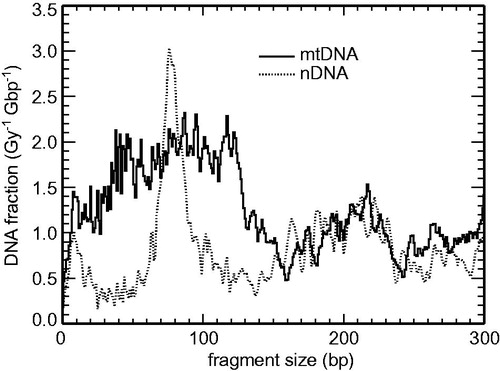
Figure 4. Calculated small-scale DNA fragmentation patterns in mitochondrial DNA (mtDNA, solid lines) compared to nuclear DNA (nDNA, dotted lines) due to single tracks of 5 MeV α-particles.