
Figures & data
Figure 1. The workflow of the study: C57Bl/6 mice were irradiated with different doses of ionizing radiation (0, 0.1, and 2 Gy). Mice were sacrificed 24 h later, bone marrow from femur and tibia, and whole blood from hepatic vein were collected. Plasma was separated from blood, extracellular vesicles were isolated and were subjected to miRNA profiling. Extracellular vesicles were isolated from the bone marrow supernatant as well. Bystander effects were monitored by injecting the bone marrow-derived extracellular vesicles in sham-irradiated healthy mice and 24 h later blood was harvested similarly to the directly irradiated animals. Protein profiling was performed from the plasma of directly irradiated and bystander animals.
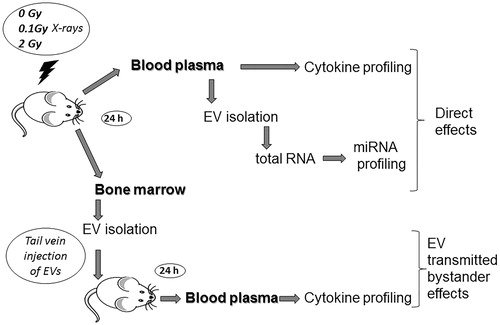
Figure 2. Western blot analysis of plasma-derived extracellular vesicles extracellular vesicles were isolated with Exiqon’s miRCURY Exosome Isolation Kit – Serum and Plasma and western blot analysis of extracellular vesicles for calnexin, TSG101 and CD9 was performed as detailed in the Materials and methods section. The blot shows, whole cell lysate (lane 1), plasma extracellular vesicles isolated from sham irradiated mice (lane 2), total-body irradiated mice with 0.1 Gy (lane 3) and 2 Gy (lane 4). The sizes (in kD) of the investigated proteins are shown on the right.
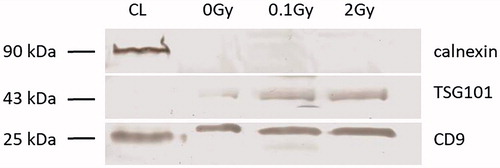
Figure 3. Protein profiling of blood from directly irradiated and bystander animals plasma was separated from whole blood by centrifugation and loaded on proteome profiler antibody array membranes. Spots were detected by chemiluminescent method as detailed in the Materials and methods section. The graph shows fold change differences in protein levels in directly irradiated mice compared to sham-irradiated mice (a and b) or in bystander mice compared to mice injected with EVs from sham-irradiated mice (c and d). Bars represent mean ± standard deviations (SD) (N = 3). Significance was tested by Student’s t-test (*p < .05, **p < .01, ***p < .001).
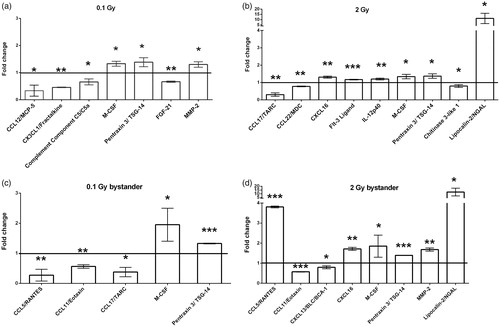
Figure 4. miRNAs differentially expressed in plasma-derived extracellular vesicles from irradiated mice. A miRNA profiling of extracellular vesicles isolated from plasma of sham irradiated mice and mice irradiated with 0.1 or 2 Gy was performed by a qPCR array comprising of 752 miRNAs as described in the Materials and methods section. miRNAs with significantly modulated expression levels after 0.1 Gy (a) and 2 Gy (b) relative to sham-treated controls are presented. Data are the mean ± SD of 3 independent experiments. Significance was tested by Student’s t-test (*p < .05, **p < .01, ***p < .001).
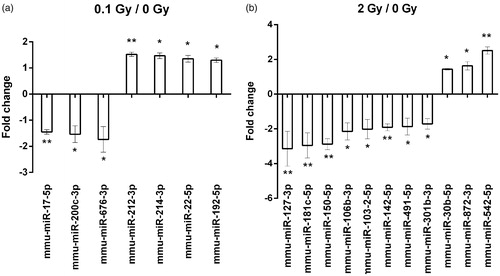
Table 1. KEGG pathways affected by both low and high dose irradiations, the number of regulated genes within the pathways and the number of miRNAs targeting these genes.
Table 2. miRNAs and their target mRNAs participating in AML pathway.
Table 3. miRNAs and their target mRNAs participating in TGFβ pathway.
Table 4. Immune- and inflammation-related common pathways regulated by differentially expressed miRNAs in the EVs derived from plasma and BM.
Table 5. Altered plasma proteins in bystander animals and their putative miRNA regulators which were differentially expressed in BM-derived EVs from irradiated animals.