Figures & data
Figure 1. Released levels of the interleukin-8 (IL-8) in supernatant without TNF-α induction (a) and with TNF-α induction (b). The cytokine concentration was determined by multiplex assay at five time points after irradiation with low doses of X-rays. Changes in cytokine concentrations are presented as mean (pg/ml)±standard deviation (SD) from three independent experiments; Asterisks illustrate significance: *p < .05, **p < .01, ***p < .001.
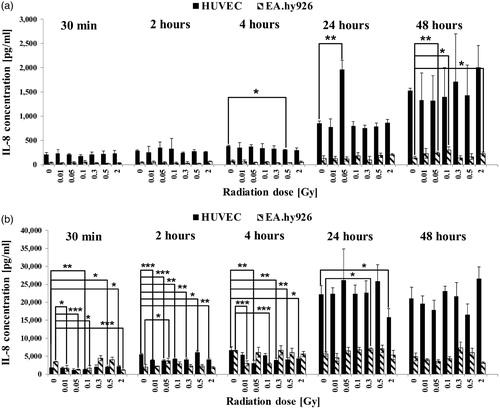
Figure 2. Released levels of granulocyte macrophage colony-stimulating factor (G-CSF) in supernatant without TNF-α induction (a) and with TNF-α induction (b). The cytokine concentration was determined by multiplex assay at five time points after irradiation with low doses of X-rays. Changes in cytokine concentrations are presented as mean (pg/ml)±standard deviation (SD) from three independent experiments; Asterisks illustrate significance: *p < .05, **p < .01, ***p < .001.
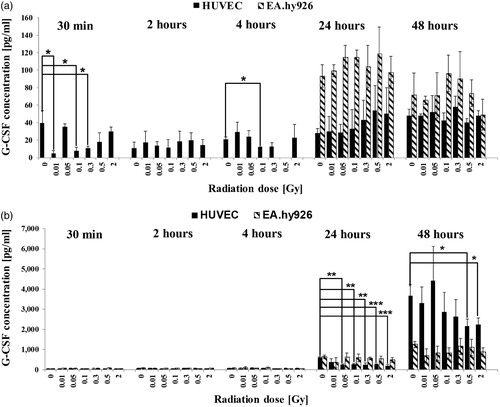
Figure 3. Released levels of platelet-derived growth factor (PDGF-BB) in supernatant without TNF-α induction (a) and with TNF-α induction (b). The cytokine concentration was determined by multiplex assay at five time points after irradiation with low doses of X-rays. Changes in cytokine concentrations are presented as mean (pg/ml)±standard deviation (SD) from three independent experiments; Asterisks illustrate significance: *p < .05, **p < .01, ***p < .001.
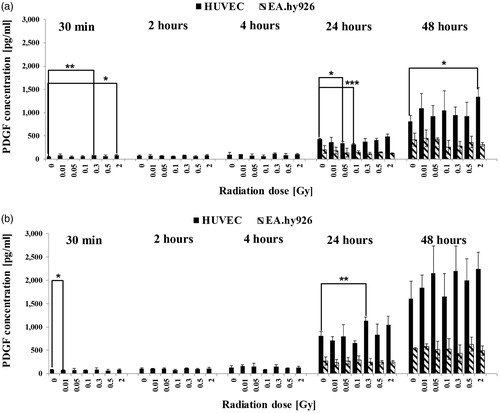
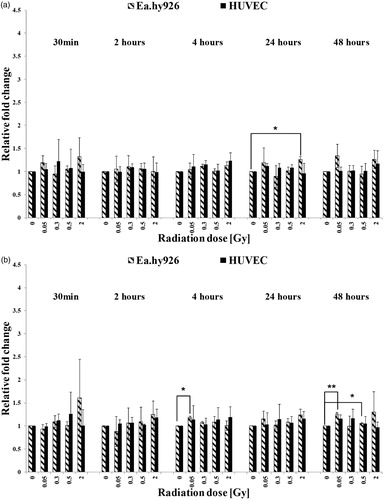
Figure 4. Expression levels of IL-8 in cultured endothelial cells without TNF-α induction (a) and with TNF-α induction (b). The mRNA-expression was determined by qRT-PCR and the relative quantification to GAPDH was performed by using the Delta Delta CT (2–ΔΔCT) method. Asterisks illustrate significance: *p < .05, **p < .01.
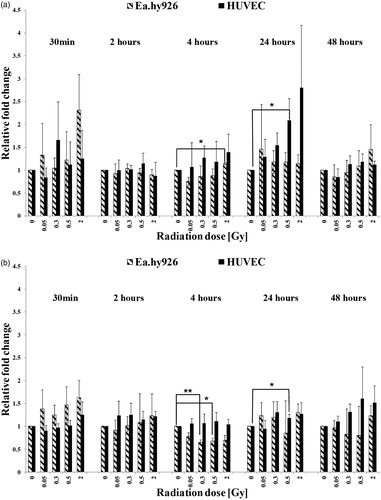
Figure 5. Expression levels of G-CSF in cultured endothelial cells without TNF-α induction (a) and with TNF-α induction (b). The mRNA-expression was determined by qRT-PCR and the relative quantification to GAPDH was performed by using the Delta Delta CT (2–ΔΔCT) method. Asterisks illustrate significance: *p < .05, **p < .01.
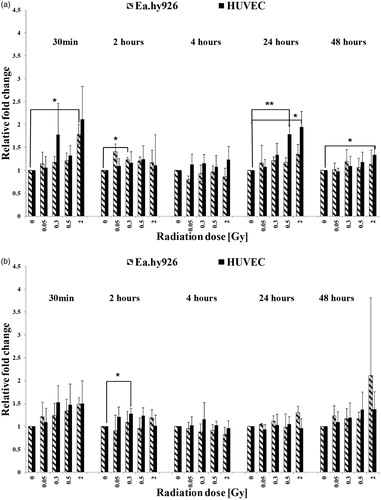
Figure 6. Expression levels of PDGF-BB in cultured endothelial cells without TNF-α induction (a) and with TNF-α induction (b). The mRNA-expression was determined by qRT-PCR and the relative quantification to GAPDH was performed by using the Delta Delta CT (2–ΔΔCT) method. Asterisks illustrate significance: *p < .05, **p < .01.