Figures & data
Figure 1. Schematic representation of the experimental procedures.
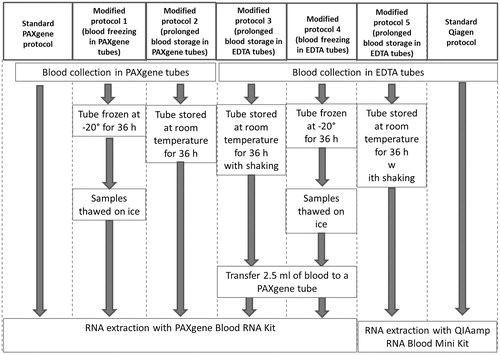
Table 1. Donor information.
Table 2. Information on doses and time points assigned to blind samples.
Figure 2. Comparison of RNA extraction protocols. (A) Quantity of RNA extracted following each protocol. Statistical comparison performed using two-tailed paired t-test. In case two bars are mark with the same letter(s) the difference is not statistically significant (p > .05), if the letters are different the difference between two conditions is statistically significant. (B) Quality of RNA extracted following each protocol. Statistical comparison performed using two-tailed paired t-test. In case two bars are mark with the same letter(s) the difference is not statistically significant (p > .05), if the letters are different the difference between two conditions is statistically significant. (C) Levels of contamination of RNA extracted from whole blood samples with PAXgene and QIAmp kits with excessive globin mRNA assessed as expression of α- and β-globin coding genes. Statistical comparison performed using unpaired t-test. SP: standard protocol; MP: modified protocol. Bars represent the mean of five measurement, error bars represent SD. **p < .005, ***p < .001.
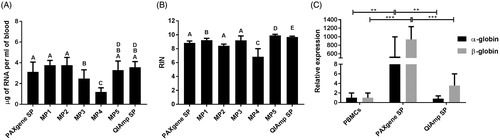
Figure 3. (A–E) Heatmaps showing the average of expression levels in seven donors (relative to control samples per time point, log2 transformed) for all the 25 genes (shown in rows) included in the qPCR arrays in response to exposure to different doses (shown in columns) at five time points. (F) Heatmap showing the relative expression levels in sham-irradiated samples from seven donors relative to sham-irradiated samples at 8 h for all the 25 genes (shown in rows) at five time points (shown in columns).
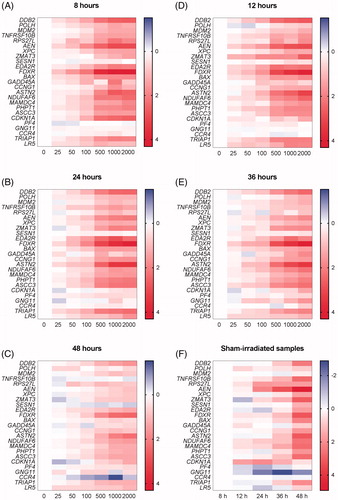
Table 3. Dose and time point prediction results for blind samples.
Figure 4. (A–C) Changes in expression of FDXR, DDB2 and TNFRSF10B relative to sham-irradiated samples at 8 h time point. Bars represent the average of samples from seven donors irradiated in vitro with doses from 0 to 2000 mGy and fixed at 5 time points after exposure. (D–F) Changes in expression of FDXR, DDB2 and TNFRSF10B relative to sham-irradiated samples per time point. Bars represent the average of samples from seven donors irradiated in vitro with doses from 0 to 2000 mGy and fixed at 5 time points after exposure.
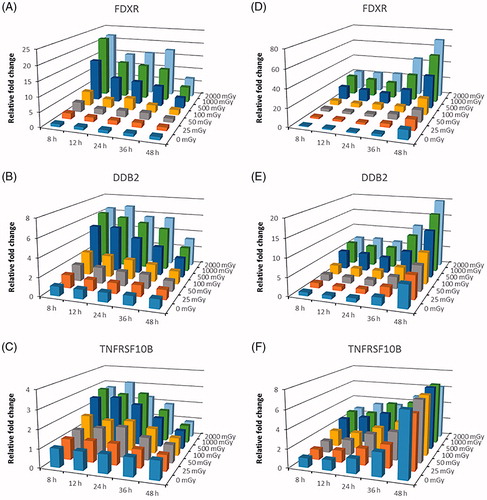
Figure 5. The decision tree for the REPTree model built for dose prediction, ending with 11 leaves (for each the dose prediction is calculated).
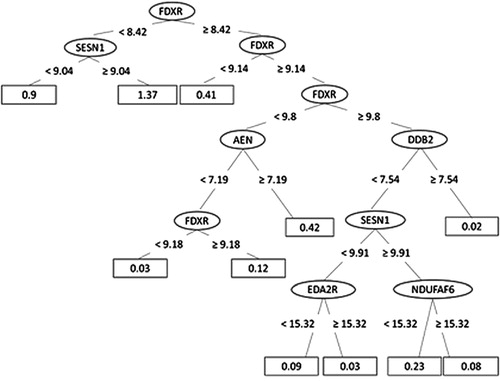
Figure 6. The decision tree for the M5Base model built for time point prediction, ending with 23 leaves (for each a linear model named LM1-LM23 has been calculated).
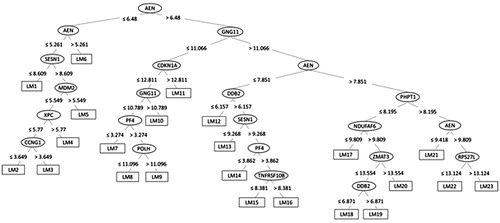
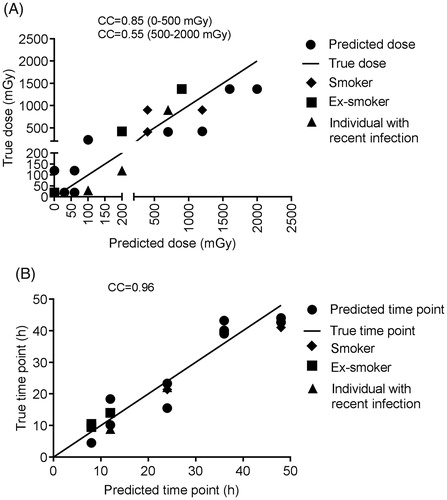
Figure 7. Dose (A) and time point (B) prediction results for the blind samples. CC: correlation coefficient.