Figures & data
Table 1. Timing of calendar year and fiscal year for funding, currency, and currency rate compared with US dollar (USD).
Figure 1. Longitudinal trends in funding landscape for radiation research in Canada. Key events/developments affecting funding streams or shift in scientific interest are shown at the bottom of the diagram. *, the landscape reflects qualitative, not quantitative, assessment of funding sources relative to each other; no trends for absolute amounts were assessed. **, the spike reflects a CAD 50 M investment from the CANDU Owners Group toward the construction of the Biological Research Facility for low-dose radiation biological studies at Chalk River Laboratories.
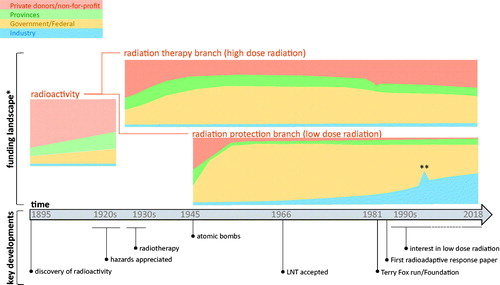
Table 2. Major radiation research grant-based funding institutions in Canada and respective recent past (1999–2007) and present (2008–2018) funding allocations.
Table 3. Number of Euratom research and technological development (RTD) projects grouped by field of research platforms from FP4 to FP7.
Table 4. Percentage of overall EC funding per target platform, broken down by framework programs (based on CORDIS); for FP4 as far as information could be retrieved.
Figure 2. A trend in the total amount of Grants-in-aid for Scientific Research in the fields related to radiation biology. Funds for research subjects under the following fields are summed: ‘radiobiology’ (1972–1992), ‘environmental effects assessment (including radiobiology)’ (1993–2002), and ‘risk sciences of radiation/chemicals’ (2003–2012). Created from data in NII (Citation2018).
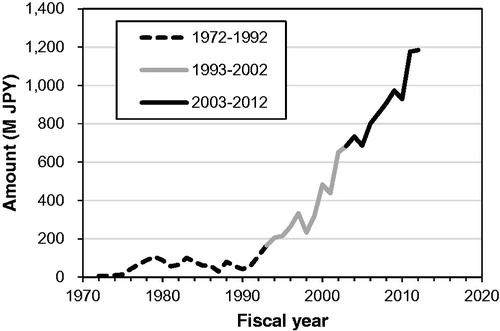
Figure 3. Governmental investment on NIRS. (A) Trends in the annual budget of grants for administrative expense (orange) and facilities grant (grey). Data are from NIRS (Citation1977, Citation1987, Citation2018) and its annual project plans. Breakdown of annual budgets of grants for administrative expense in million (M) JPY in 1995 (B) and 2015 (C). (B) Nuclear energy fundamental research, safety analysis research and about two third of the radiological priority research were related to radiation safety research and radiobiology. (C) Employment expenses are included in each project in C. Data taken from NIRS (Citation1995, Citation2018).
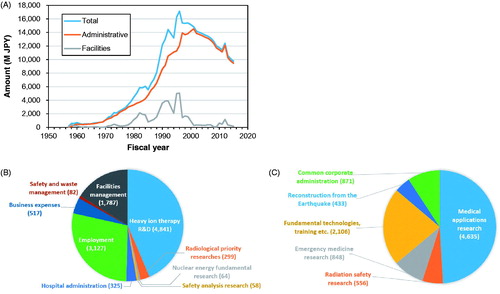
Figure 4. Trend in the annual amount of funding on radiobiology-related facilities and commissioned projects of IES. Amounts include employment expenses and exclude funding for radioecology.
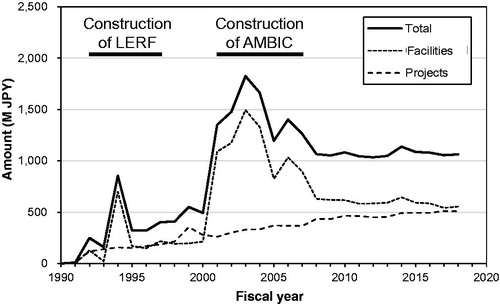
Figure 5. Temporal changes in the annual budget of the MOE project.
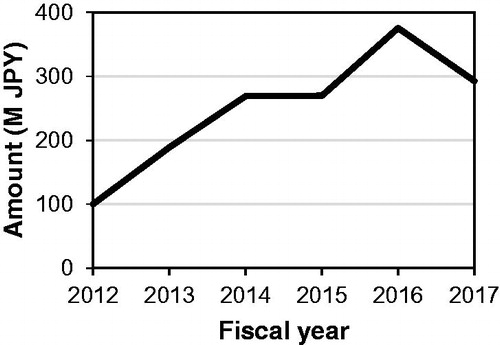
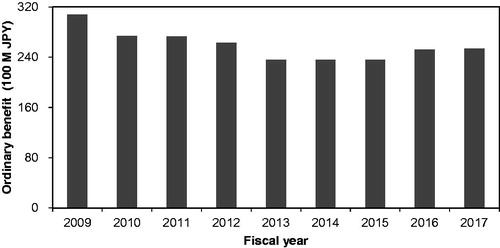
Figure 6. Temporal changes in the institutional ordinary benefit received from Japanese electric power companies during fiscal years FY 2009 through 2017. The data were replotted from CRIEPI (Citation2018).