Figures & data
Figure 1. (a) A schematic diagram of CSE extraction and culture medium treatment and (b) a picture of the actual CSE extraction devices and pure CSE solution.
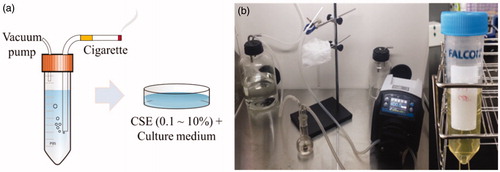
Table 1. The pHs of culture media containing varying amounts of CSE under different CO2 concentrations in atmosphere.
Figure 2. A schematic diagram of isobologram and regional categories for different combined effects of two influential factors A and B.
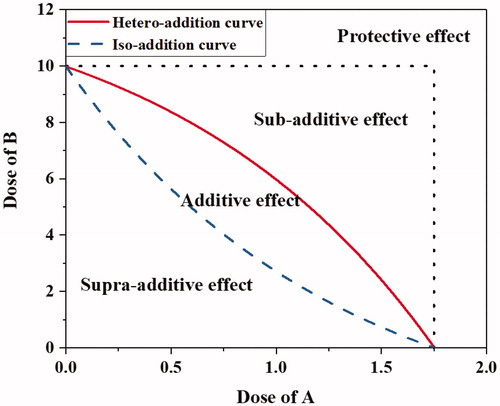
Figure 3. The numbers of gamma-H2AX foci per cell, normalized to 1 for the control (0 Gy or CSE-free culture medium, respectively), in BEAS-2B, SVEC4-10EHR1 and Nuli-1 cells after (a) alpha particle exposures in CSE-free culture media at doses of up to 0.25 Gy and (b) CSE treatments at concentrations of up to 10% without alpha particle exposure. The error bars represent standard errors.
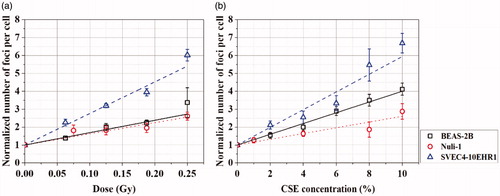
Figure 4. The numbers of gamma-H2AX foci per cell (black rectangles), normalized to 1 for the control (0 Gy and CSE-free culture medium), in (a) BEAS-2B, (b) Nuli-1 and (c) SVEC4-10EHR1 cells after alpha particle exposures in culture media treated with 4, 6 or 8% of CSE. The values for 0.00 Gy equal the corresponding numbers of foci at 4%, 6%, or 8% of CSE treatment from . The numbers of gamma-H2AX foci per cell expected from a multiplicative mode (red circles) or an additive mode (blue triangles) of combined effect are marked in the corresponding graph for comparison. The error bars represent standard errors.
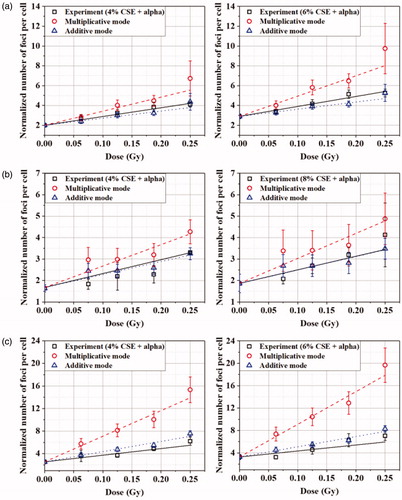
Figure 5. Clonogenic surviving fractions of BEAS-2B and SVEC4-10EHR1 cells after (a) alpha particle exposures at doses of up to 5 Gy and (b, b*) CSE treatments at concentrations of up to 12%. The linearly-fitted surviving fractions (b*) from CSE treatment were depicted in a semi-log scale (b) for direct comparison with those from alpha particle exposure. The error bars represent standard errors.
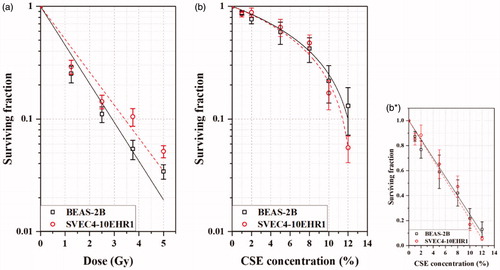
Figure 6. The clonogenic surviving fractions of BEAS-2B (a, c) and SVEC4-10EHR1 (b, d) cells, varying with the dose of alpha particle exposure in the CSE-free or CSE-treated culture medium: (a, b) with the SF value at 0 Gy in CSE-free culture medium normalized to 1 and (c, d) with the SF values at 0 Gy normalized to 1 individually for different CSE concentrations in the culture medium. The error bars represent standard errors.
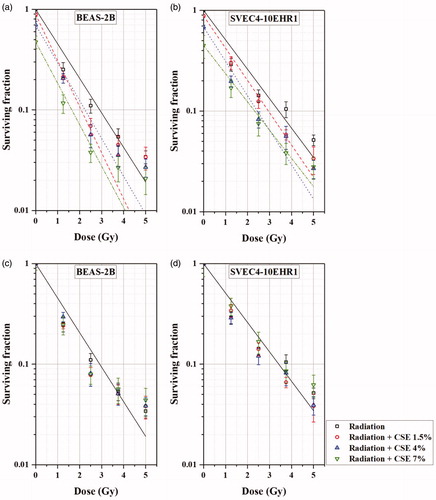
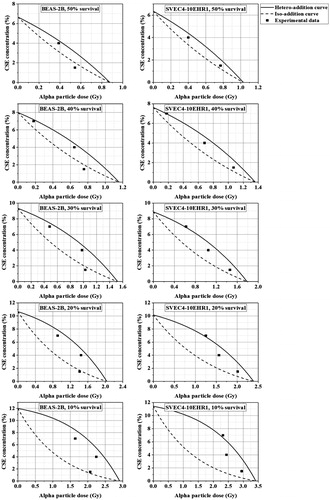
Figure 7. Isobolograms for the target clonogenic survivals of 10 to 50%: BEAS-2B cells (left column) and SVEC4-10EHR1 cells (right column).