Figures & data
Figure 1. Experimental setup for assessing effect of beam spoiler. The OSLDs were irradiated with a 0.8 cm beam spoiler located 5 cm from the surface of a phantom comprised of 10 cm of Gammex® Solid Water designed to produce full back-scatter to the detectors. The spoiler is held on the side with foam blocks to limit scatter. Doses were compared to those measured without spoiler and 1.5 cm solid water buildup (e.g. 100% dose) to assess the bolus-ing effect of the acrylic spoiler.
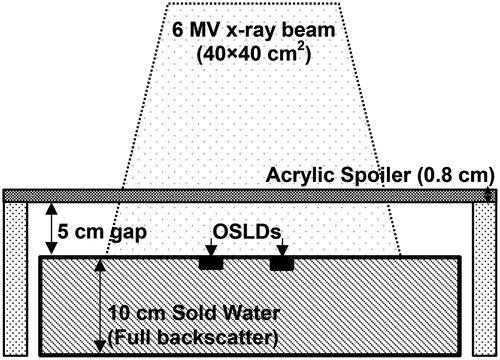
Figure 2. Cumulative dose volume histogram comparing dose coverage of the bilateral technique with lack of bolus/spoiler (top) or an alternative anterior/posterior irradiation geometry (bottom). In both cases, the bilateral technique achieves a much more uniform dose distribution, with minimum coverage by the 95% isodose line and a maximal dose of ∼107%, typically in the extremities (e.g. head, feet) where separation is reduced.
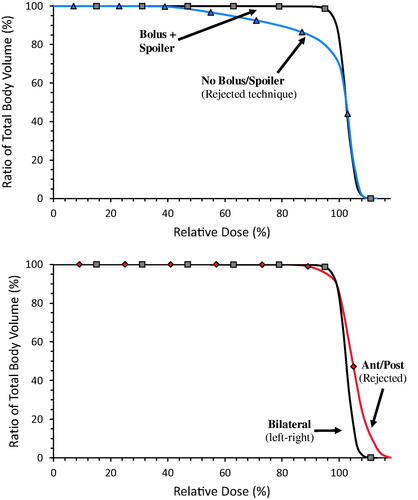
Figure 3. Isodose distributions in the absence (left) vs in the presence (right) of bolus and spoiler for an identical prescribed dose at mid-depth at the thorax (A), abdomen (B), and pelvis (C). Without bolus, the depth in which the dose reaches 95% is of the order of ∼0.6–0.7 cm. With bolus, the entire animal is covered by at least 90%, with 95% occurring within the first 0.1–0.2 cm below the surface. Of particular note, some of the bones (contoured in yellow) are not entirely covered by the 90% and 95% isodoses in the absence of bolus (see arrows).
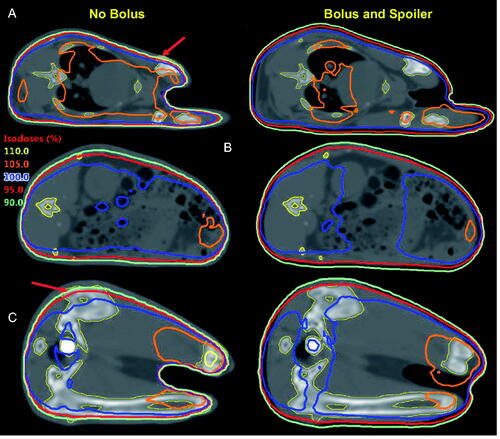
Figure 4. DVH values for the min/95%/median/95%/max organ doses in the single representative scanned animal for the bilateral technique with or without surface dose management (i.e. bolus and spoiler). Dose to organs is generally similar between both cases except for the bowel and, more importantly, the bones which harbor the all-important bone marrow where >5% of the volumes lie in areas covered by <90% of the prescribed dose.
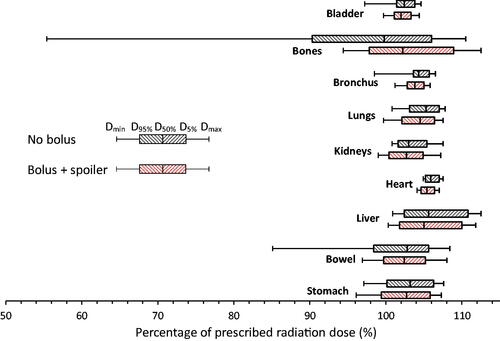
Figure 5. Irradiation geometry. The linear accelerator is calibrated to deliver dose at the Isocenter. The mid-depth of the animal is placed at isocenter, and two lateral beams (above and below the animal, at gantry 0° and 180°, respectively) are used. The animals are held within the radiation field’s maximal 40 × 40 cm2. Dose at shallow depths in the animal is enhanced using the bolus (underneath animal) and beam spoiler (∼5 cm above animal). The isocentric design of the irradiation technique allows for rotating the gantry between beam deliveries without requiring manual adjustments to the setup in mid-delivery.
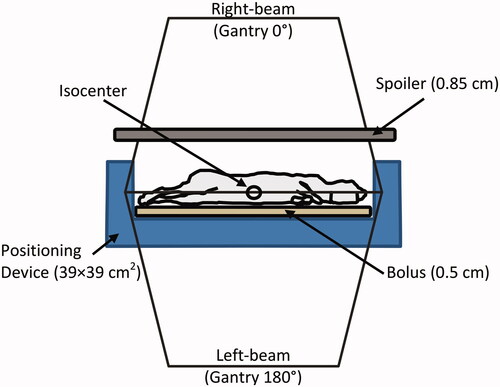
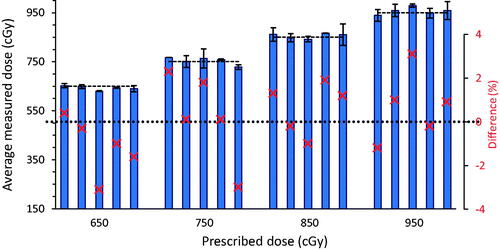
Figure 6. Average in-vivo OSLD dose measurements for all 20 rabbits exposed at 4 different prescribed dose levels (dashed lines). Error bars indicate the measurement standard deviation. Red crosses represent the difference between measured and prescribed dose (dotted line and scale to the right). No measurement exceeded 3.1% from prescribed dose, even though OSLD measurement statistical uncertainty is ∼5% in individual detectors (2.5% for mean of 4 OSLDs).
Rabbit_Paper_sup_materials_appendix_1.docx
Download MS Word (30.7 KB)Data availability
Raw data were generated at the University of Maryland School of Medicine. The authors confirm that all data supporting the findings of this study will be archived at the UMSOM for up to 5-years post-publication, and are available from the corresponding author (Yannick Poirier), upon reasonable request, and with approval by the Biomedical Advanced Research and Development Authority, Office of the Assistant Secretary for Preparedness and Response, Department of Health and Human Services. While the Biomedical Advanced Research and Development Authority funded the study, the study’s conclusions are those of its authors alone.
