Figures & data
Figure 1. A. Kaplan-Meier curves for 45-day survival following exposure to 6.5 to 9.5 Gy of 6 MV photon total body irradiation (TBI). Animals were exposed to graded doses of total body irradiation (6.5 to 9.5 Gy, 1 Gy increments; n = 5/dose). All animals succumbed to radiation-induced mortality between day 7 and day 15 postTBI. Animals surviving to day 15 demonstrated a recovery in hematological, serum chemistry, and clotting kinetics by day 45. On gross exam, no overt signs of tissue damage were noted. However, histology exam showed extensive pathology. B. Logistic-regression analysis for 45-day mortality with 95% confidence interval. The LD10 is estimated to be 6.30 Gy with 99% lethality at 9.05 Gy. The LD50 is estimated to be 7.19 Gy and the LD70 is estimated to be 7.53 Gy.
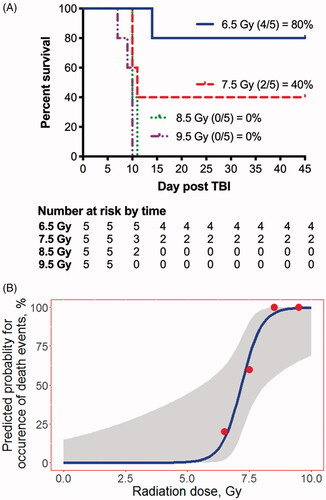
Figure 2. Bone marrow failure following TBI in the NZW rabbit presented by radiation dose. Complete blood count with differential was performed by Antech Diagnostics, Inc., on samples collected at baseline (-5 day), and at day 1, 3, 5, 7, 10, 14, 17, 20, 27, 30, and 45 postTBI. The familiar drop in white blood cell (WBC) count (A), absolute lymphocyte cell (ALC) count (B) and absolute neutrophil count (ANC, C) is evident, suggesting the model presents with bone marrow failure as expected following total body irradiation (TBI) across the dose range between 6.5 to 9.5 Gy. Platelets (D) red blood cell (RBC) counts (E), and hematocrit (F) began to decline on the fifth to seventh day post-exposure and reached a nadir during the second week post-TBI. Data in panels A-E are presented on a log-scale as mean SEM. Data in panel 5 is presented on a linear scale as mean
SEM.
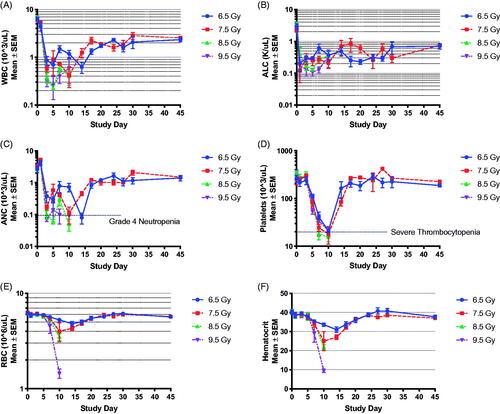
Table 1. Neutrophil related parameters in New Zealand rabbits after total body irradiation.
Figure 3. Boxplots of nadirs of ANC, Platelets and Hemoglobin in New Zealand Rabbits. The differences in the absolute nadir value between different radiation arms were not significantly different.
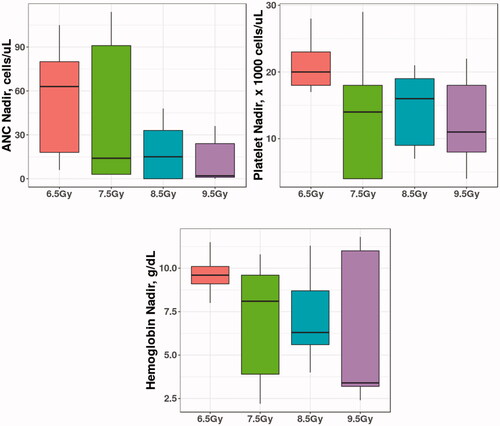
Table 2. Platelet related parameters in New Zealand rabbits after total body irradiation.
Figure 4. Gross hemorrhage observed in the skin and vital organs at necropsy. Representative photographs of gross abnormalities in vital organs were taken at necropsy. Moribund animals presented with visible petechial hemorrhage in the skin, mottled liver, bleeding in the stomach, abdominal cavity, and gastrointestinal tract at TBI doses of 7.5 Gy and higher. Hemorrhage was also observed in the lungs, but it was unclear whether this was due to cardiac puncture at the time of euthanasia or due to TBI.
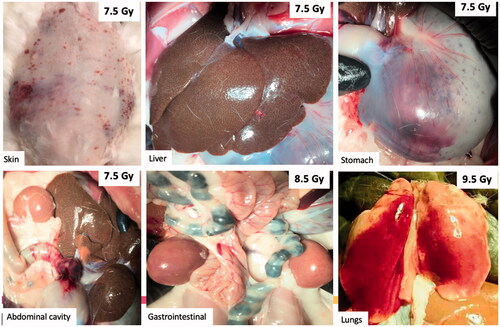
Figure 5. Evaluation of clotting parameters using rotational thromboelastometry (ROTEM) performed on whole blood at baseline and at the time of scheduled or unscheduled euthanasia. (A) Among animals expiring prior to the 45-day study endpoint (e.g. decedents), clotting time was severely prolonged in comparison to baseline draws. Clotting times among 45-day survivors at 6.5 and 7.5 Gy was slightly longer compared to baseline but did not reach statistical significance (paired t-test, p > .05). (B) No significance differences were observed in clot formation time between 45-day survivors and baseline values. In contrast, blood drawn from decedents at 7.5 to 9.5 Gy was unable to clot. In this graph, 3600 s was used to represent a 60 min run without clot formation. (C) 45-day survivors showed a trend towards increased maximum clot firmness suggesting stronger clot formation at the scheduled study endpoint compared to baseline, although this did not reach significance (p > .05). In contrast, maximum clot firmness among decedents, when evaluable, was severely reduced. Maximum clot firmness was not reported in all decedents due to platelet deficiency. (D) The alpha-angle was similar among all subjects at baseline except for one outlier in the 7.5 Gy TBI cohort. The outlier in the 7.5 Gy arm was consistently lower than for all other animals over three blood draws on separate days. 45-day survivors presented with a similar alpha-angle as the baseline values. In decedents at 7.5 to 9.5 Gy, a decrease in the alpha angle was noted.
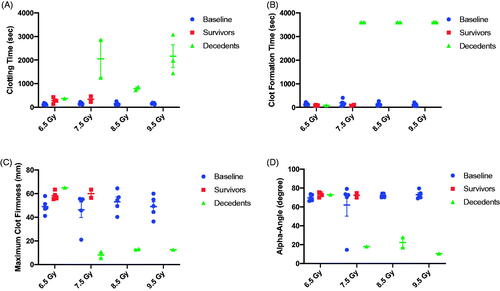
Figure 6. Inhibition of thrombin generation at time of scheduled or unscheduled necropsy is observed in animals euthanized prior to the 45-day study endpoint. Thrombin generation was severely inhibited among animals euthanized prior to the study endpoint due to meeting the criteria for imminent mortality. Data is reported as the peak height (Thrombin, nM), lag time, time to peak, and estimated potential for thrombin generation (area under the curve).
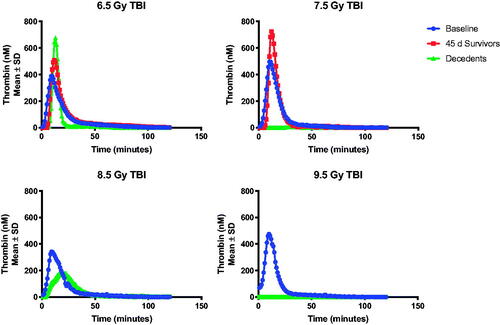
Figure 7. ADAMTS13 percent activity, plasminogen, and fibrin degradation products.
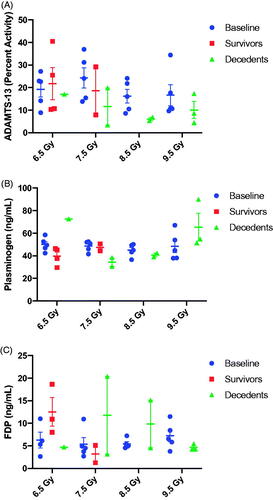
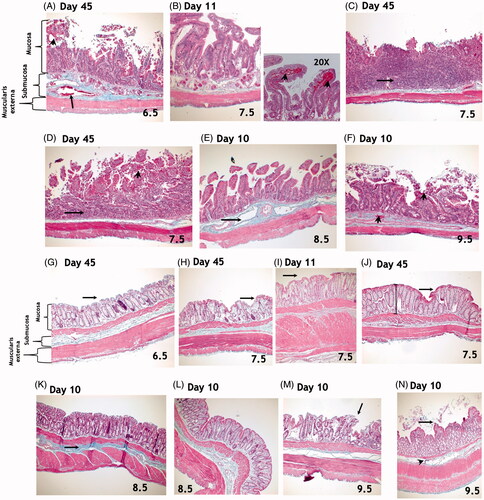
Figure 8. Top Panel: Masson’s trichrome staining of the small intestine. There were no significant differences in radiation-induced effects in the duodenum, jejunum, or ileum. (A) Microscopic exam of small intestines from animals exposed to 6.5 Gy TBI and surviving to day 45 reveals dilation of submucosal blood vessels (arrow), elongation of crypts, loss of surface epithelial cells, and mucosal hemorrhage (arrow head). (B) Findings in animals exposed to 7.5 Gy and euthanized during the second week included intact villi but with loss of epithelial cells, particularly at the tips along the length of the small intestine. Mucosal hemorrhage (arrowheads in 20X photomicrograph) was also a histological feature at this time. (C–D) At 45-days post-exposure to 7.5 Gy TBI, complete loss of villi and crypts with replacement by inflammatory infiltrate (arrows) and mucosal hemorrhage (arrowhead) were observed, suggesting persistent GI damage. (E) Damage to the small intestine was variable among animals in the 8.5 to 9.5 Gy arms that expired prior to the study endpoint of 45-days. Findings include evidence of submucosal edema and vasodilation (arrow, E). (F) Epithelial sloughing, loss of villi and crypts, mucosal and submucosal hemorrhage (arrowheads) were observed. All images were taken at 10x magnification, unless otherwise noted above. Bottom Panel: Masson’s trichrome staining of the colon. Overall, there was less damage to the colon than to the small intestines at all radiation doses. Animals exposed to 6.5 or 7.5 Gy TBI and surviving to day 45 had mostly intact epithelial layers in the colon (arrows, G-J). Findings included abnormal crypts (I, J) and increased mucosal depth (shown by lines in J). In animals exposed to 8.5 and 9.5 Gy, damage to the colon was somewhat variable. Findings included increased deposition of collagen strands in the submucosa (K, arrow), loss of surface epithelial cells (arrows, L, M) and disorganized crypts (L - N). All images were taken at 10x magnification, unless otherwise noted above.