Figures & data
Figure 1. Survival curves and cause of death in NHPs after TBI and treatment with sargramostim and/or azithromycin. (A) Survival curve comparisons of Groups 1 (reference item/vehicle 48 h) and 2 (sargramostim 48 h). (B) Survival curve comparisons of Groups 6 (reference item/vehicle 48 h + azithromycin) and 7 (sargramostim 48 h + azithromycin). Logistic regression model for comparing the mortality frequencies at Day 60 showed an overall statistically significant dose effect (t-test, p = .0032). (C) Most likely cause of death of moribund animals in each group.
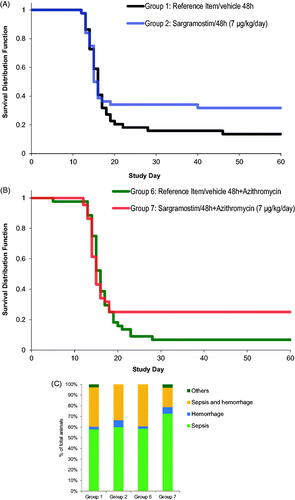
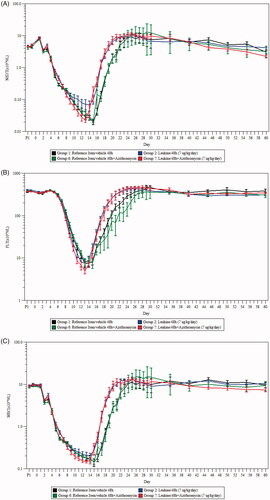
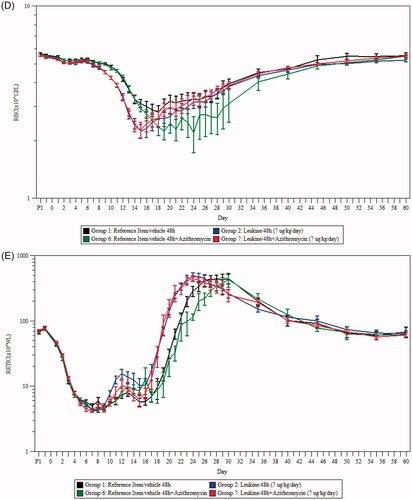
Table 1. Summary of neutrophil- and platelet-related hematology parameters.
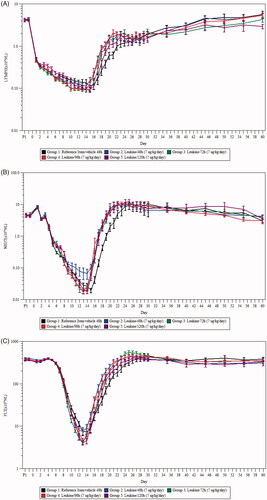
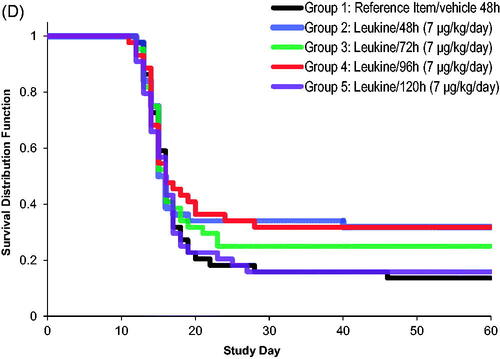
Figure 4. Percentage of animals with sepsis following irradiation and treatment with sargramostim and/or azithromycin. (A) Percentage of total animals across all groups, both moribund and surviving, presenting as septic or non-septic (n = 308). Septic is defined as animals presenting with at least two positive bacteriology results in organ and blood culture. (B) Percentage of total animals within each group, both moribund and surviving, presenting as septic or non-septic (n = 44 per group; 22 males and 22 females). Group 1 (reference item/vehicle 48 h); Group 2 (sargramostim 48 h); Group 6 (reference item/vehicle 48 h + azithromycin); Group 7 (sargramostim 48 h + azithromycin). **p≤.01.
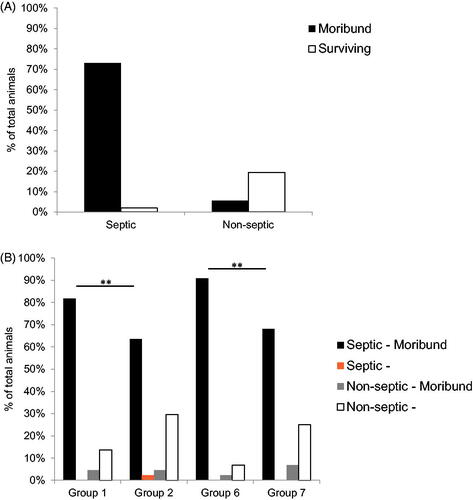
Figure 5. Bacteriology of study animals post irradiation. (A) Percentage of total animals with at least one positive bacterial identification in the brain, heart, liver, lung (left and right caudal lobes), spleen, and kidneys post mortem. Moribund is defined as animals which were removed before endpoint of 60 days. (B) Categorization of the species of bacteria found in both organ and hemocultures of study animals (both moribund and surviving to termination) from all groups. n = 308.
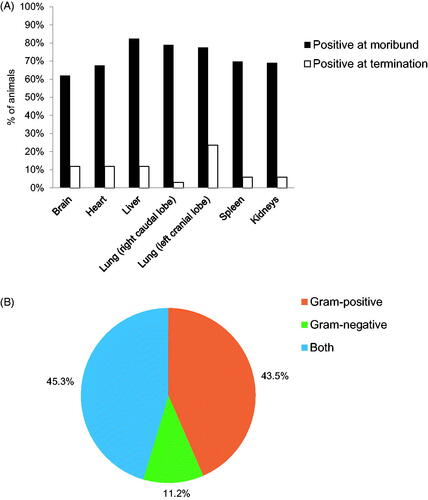
Table 2. Gram-positive and -negative bacteria identified in organ and hemocultures.
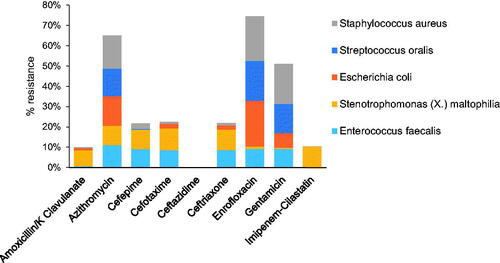
Figure 6. Summary of the antibiogram of the top five most common bacterial strains identified in organ and hemocultures. The cumulative resistance of the identified bacterial strains against a panel of commonly used broad-spectrum antibiotics. Results are pooled from animals of all groups (n = 308), both moribund and surviving.