Figures & data
Figure 1. Radiation dose received during a range of environmental and medical sources. Background radiation can vary substantially depending on location. Single and repeated exposure from radiodiagnostic procedures can result in exposure to a range of doses and dose rates. For example, during mammography 2 mGy can be delivered in some minutes; for CT examination, 10 to 40 mGy is delivered in tens of minutes; during interventional radiology, 10–200 mGy is received over some hours. Exposure for radiation workers is normally much lower, being limited to 20 mGy per year, but can potentially be delivered (at very low dose rate) during each working day. Exposure during a 1000 km flight represents about 6-7 µSv per hour and chronic exposure to background radiation on Earth ranges between 2 and 70 mSv per year. Importantly, all these exposures can cumulate over a life-time to represent a non-negligible risk (Hall and Brenner Citation2012; Brenner Citation2014). Organ doses are given except for situations marked by asterisks where effective doses are indicated.
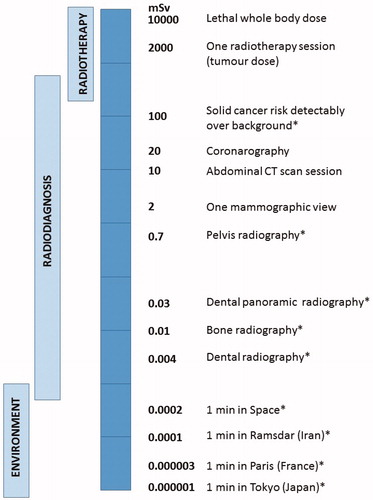
Figure 2. Grade assessment for distribution of responses to Radiotherapy. Radiotherapy doses are chosen to ensure that the majority (at least 85%) of patients display no or minor post-RT tissue reactions. Such patients are defined as showing grade 0-1 reactions. Some patients (up to 15%) show moderate tissue complications that can cause moderate to severe discomfort. Such patients fall into grade 2-3/4 responses). A small subset of patients display a severe response, which for a grade 5 response can be fatal. Patients with mutations in the genes that function in DNA non-homologous end-joining or the ATM-signaling pathway can fall into this category. The precise percentage of patients that are considered to be RS differs slightly between countries and/or departments/hospitals. Particularly critical is the assessment of whether a grade 2 response lies within the normal or RS range. Here, we have placed a grade 2 response as being within the RS category. We give the percentage of RS individuals as ∼15%, which represents an average of estimates presented in the literature.
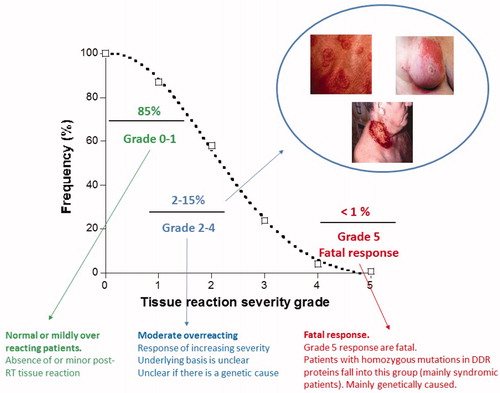
Table 1. All references for these findings are given in (Foray et al. Citation2016).
Figure 3. Functional assays that can assess the response to IR exposure in cells. A range of assays have been reported that can assess RS in cultured cells. Four of these assays have been reported to correlate with the patient response following RT (highlighted in red). In addition, GWAS studies have been carried out on patients following RT and are included in this Figure. Further assays and biomarkers are discussed in review 3 (Gomolka et al. Citation2019).
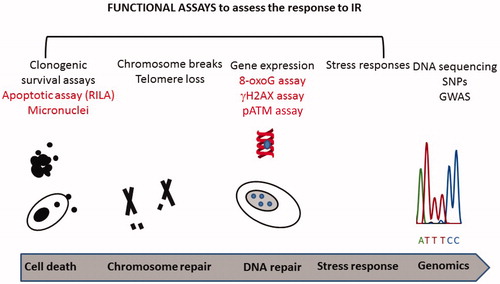
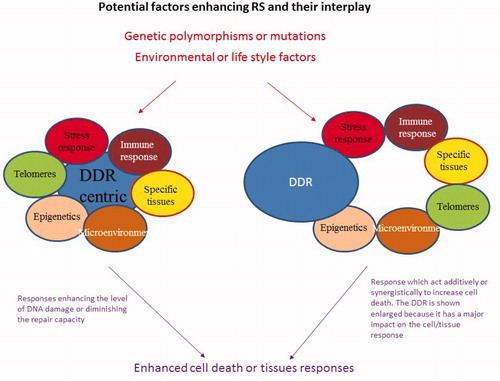
Figure 4. Potential factors or responses that could enhance RS and their interplay. The figure displays the responses that could potentially impact upon RS as discussed in the text. These responses could be regulated genetically or they could be influenced by environmental or life style factors. They could interplay to impact upon the DDR (left hand side of the figure) or could act independently but enhance DNA damage or an adverse tissue reaction (right hand side).