Figures & data
Figure 1. Cutaway diagram of the human eye lens showing the location of PSCs relative to the nucleus and cortex. The diagram also shows active (solid green arrows) or passive (dashed green arrows) transport across the humors and into the lens of glutathione (GSH) and amino acids (AA). Antioxidant GSH levels (mmol L−1 or mM) are indicated by green stars for human data (Pau et al. Citation1990; Whitson et al. Citation2016) and by a green diamond for rabbit data (estimated as 6 × 5 mmol L−1) (Giblin et al. Citation1976). The purple arrows show the preferential influx of Na+ ions (and water) at the lens poles, driven by LEC Na+/K+-ATPase pumps at the lens equator, based on the lens fluid circulation model (Mathias et al. Citation1997). The polar position of active GSH transport is purely illustrative as mostly occurs in equational and pre-equatorial regions.
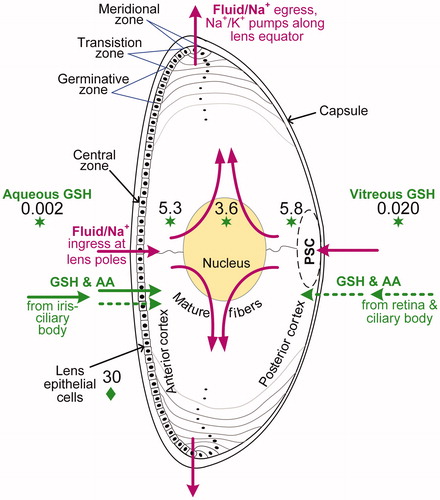
Figure 2. Cutaway diagram of the human eye lens showing some major mechanistic processes linked generally to the development of age-related cataracts, and specifically to nuclear cataracts (NC), cortical cataracts (CC), and PSCs. Biological mechanisms are shown as increased ![]()
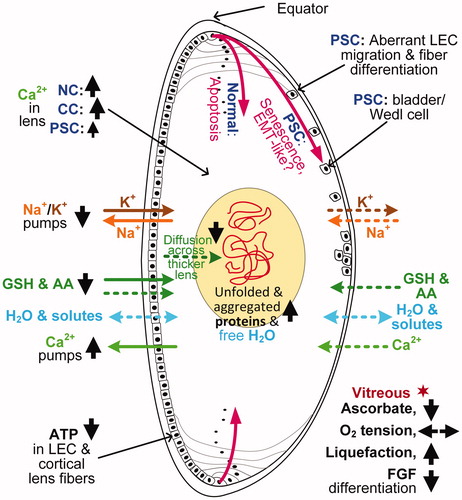
Figure 3. Cutaway diagram of the human eye showing a clear lens, with typical oxygen levels in mmHg (7.6 mmHg = 1% O2). The blue triangle, circles, stars, and square indicate oxygen measurements from human data (Helbig et al. Citation1993; Holekamp et al. Citation2005; Siegfried et al. Citation2010; Beebe et al. Citation2014, respectively) and blue diamonds indicate mean of oxygen measurements from cats, rabbits and guinea pigs (Giblin et al. Citation2009). The dashed blue arrows show the diffusion of oxygen from the atmosphere via the cornea and from vascular sources, namely, the retinal and ciliary body arterioles. The middle layer of the eye, the uvea (in red), consists of the iris, ciliary body and choroid.
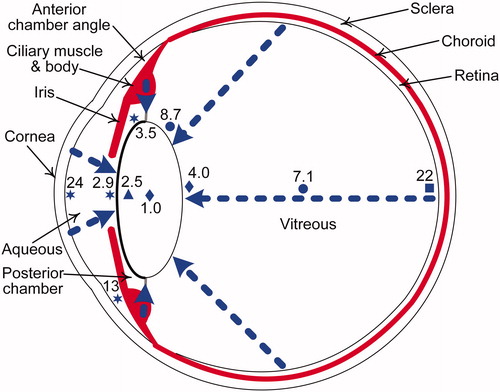
Table 1. Prevalence of cataract types for various risk factors (described in sections 2, 3 or 4), shown as strongly promoted ![]() or moderately promoted
or moderately promoted ![]() .
.
Figure 4. Diagram showing how exposure to ultraviolet (UV) radiation or ionizing radiation (IR), and changes in calcium, glucocorticoids (GC), glucose, glutathione (GSH) or inflammatory response alter LEC and lens fiber cell protein gene activity (e.g. ![]()
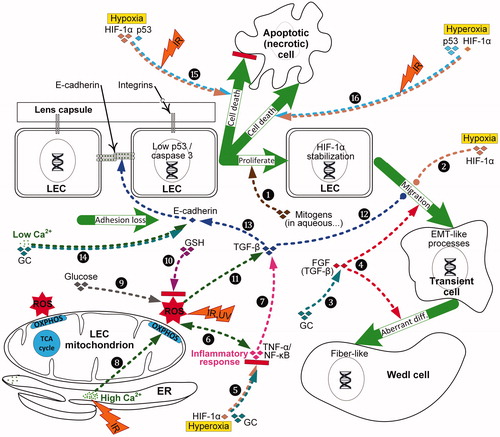
Figure 5. Hypothetical variation in the oxygen enhancement ratio (OER) is evaluated as cell death versus oxygen tension for various regions in the human eye (see ) that are exposed to low-LET 250 kVp X-rays and high-LET 5.5 MeV α-particles from radon gas. The assumed value of half-maximal O2 concentration is 4.18 mmHg (0.55% O2), while the maximum OER value is 2.70 for X-rays and 1.67 for 222Rn α-particles (Ling et al. Citation1981; Richardson Citation2008).
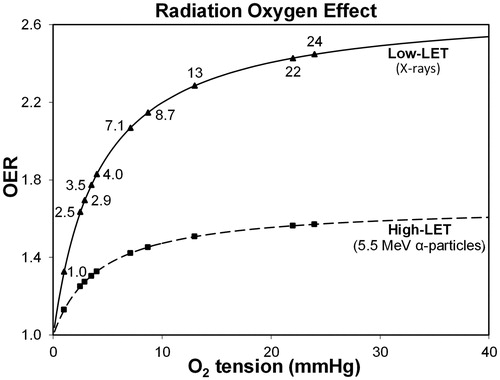
Table 2. Estimated low-LET, IR-related change in diffusion coefficient (DIR) of oxygen in the vitreous humor, resulting in changes in oxygen tension and the oxygen enhancement ratio (OER) at the posterior lens surface.
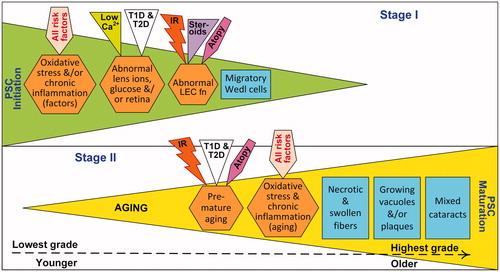
Figure 6. Proposed two stage mechanism of PSC development. In Stage I (i.e., initiation stage), risk factors promote ocular oxidative stress, inflammation, ion-pump disruption and epithelial cell defects; these effects can directly or indirectly compromise LEC function (fn). This initiation stage results in LEC proliferation, migration and aberrant fiber differentiation with the aggregation of characteristic dysplastic bladder-like fibers, or Wedl cells, at the posterior pole. Although specific risk factors have multiple effects, they are only shown once to simplify the illustration. In Stage II (i.e., maturation stage), processes associated with aging cause oxidative stress and inflammation, resulting in vacuoles and/or plaques accumulating in the posterior subcapsular region. All specific PSC risk factors shown promote both stages of development, however only atopy, type 1 or type 2 diabetes (T1D, T2D) and high dose ionizing radiation (IR) induce premature systemic aging.