Figures & data
Table 2. Gamma radiation dose rates in µGy/h in cells grown in Petri dishes of varying diameter stacked on the euxenite-(Y) source.
Figure 1. Pictures of the euxenite-(Y) source embedded in the lead tray. a: View from top. b: source positioned inside an incubator with two stacked cell culture dishes.
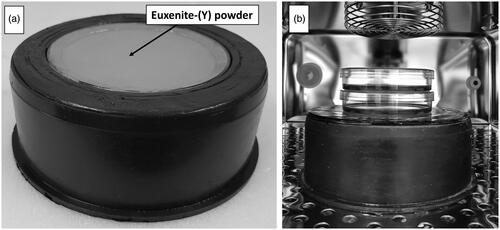
Figure 2. Energy spectrum of the euxenite-(Y) source with characteristic isotope peaks measured with a High Purity Germanium detector. The spectrum was truncated at 1750 keV. Peaks from overlapping radionuclides are labeled by lists of radionuclides.
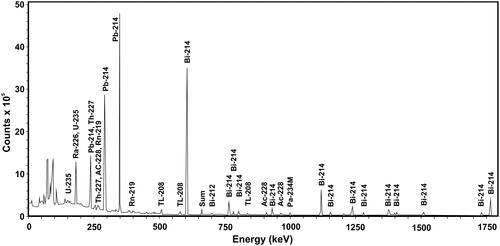
Table 1. Activities of the major radionuclides detected in the euxenite-(Y) mineral.
Figure 3. Results of TLD dosimetry of the euxenite-(Y) source. Panel a: distribution and readings (in µGy/h) of TLD dosimeters on the source. Rings symbolize radii of 5, 20, 30, 40, 50 and 55 mm. Numbers in italics above the arrow represent the calculated average dose rate for an area between two radii. Panel b: black circles represent the average dose rate measured at each radius. Error bars represent standard deviations from the individual measurements.
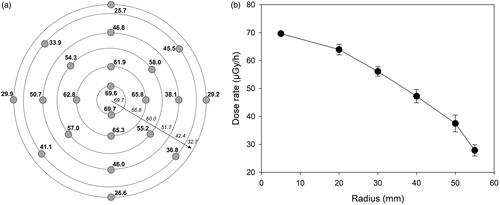
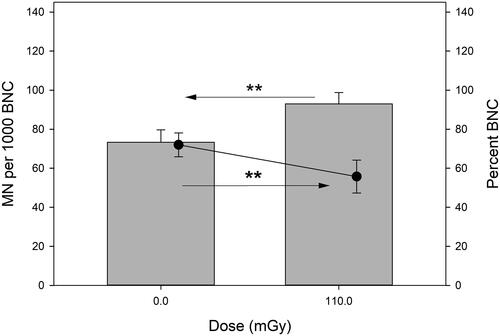
Figure 4. MN frequencies (grey bars) and percent of binucleated cells (black dots) in U2OS cells exposed to gamma radiation from the euxenite-(Y) source for 192 h. Cells receiving 10.5 mGy were exposed in stack position 1 at 55 µGy/h and cells receiving 5.9 mGy were exposed in stack position 2 at 31 µGy/h. Asterisks mark large differences (d = 0.8–1.3, Cohen’s effect size). Error bars represent standard deviations from 3 independent experiments. BNC: binucleated cell.
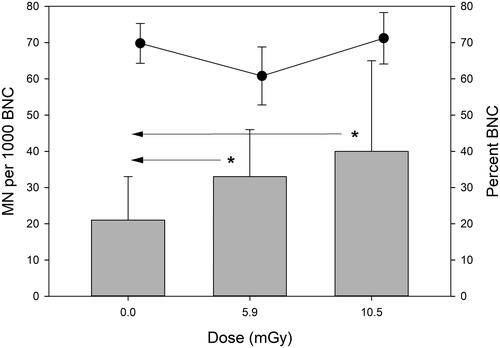
Table 3. Fitted mean energy values with standard deviations and fluence for the three investigated 241Am alpha sources (#1, #2 and #3).
Table 4. Fitted mean energy values with standard deviations for the three investigated alpha sources (#1, #2 and #3) measured in three different collimator locations on the source surface.
Figure 5. The alpha exposure setup. Panel A: polyethylene dish with Mylar foil strapped to the bottom. Panel B: A polyethylene lid with a drilled hole to allow air exchange is placed on top of the dish.
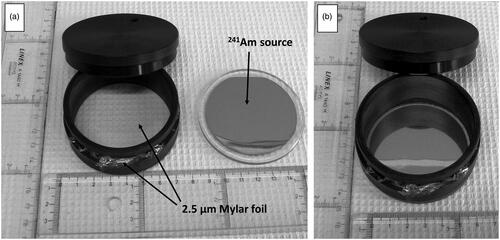
Figure 6. Characteristics of the 241Am sources. Panel a: energy spectra for the three 241Am sources. Data points represent measurements, lines represent Gaussian fits. Panel b: Graphical presentation of dose rate homogeneity of a source to cells growing on 2.5 µm Mylar calculated by Monte Carlo simulation using the Geant4 framework. Panel c: Dose rate across the source with 95% confidence intervals.
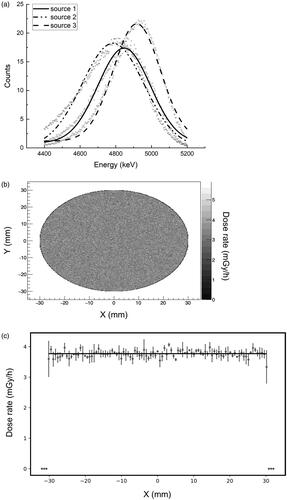
Figure 7. MN frequencies (grey bars) and percent of binucleated cells (black dots) in U2OS cells exposed to alpha radiation from a 241Am source for 100 h. Asterisks mark very large differences (d > 1.3, Cohen’s effect size). Error bars represent standard deviations from 3 independent experiments. BNC: binucleated cell.