
Figures & data
Figure 1. Effect of cryopreservation time on MN yields of cryopreserved whole blood cultures for three donors: 0 Gy (A), 0.5 Gy (B), 1 Gy (C) and 2 Gy (D). Linear regression analysis was performed for each donor separately. MN yields of irradiated samples represent radiation-induced MN counts.
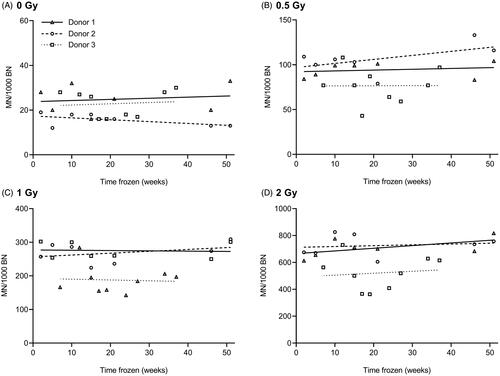
Table 1. Effect of cryopreservation time on MN yields: results from linear regression analysis.
Figure 2. Comparison between paired fresh and cryopreserved whole blood samples from healthy individuals: MN values from 20 donors (A) and NDI values from 6 donors (B). *p < 0.05, a statistically significant difference between values of fresh and cryopreserved samples for the corresponding dose (Wilcoxon signed-rank test). Cryopreservation periods range from 1 – 34 weeks. MN yields of irradiated samples represent radiation-induced MN counts.
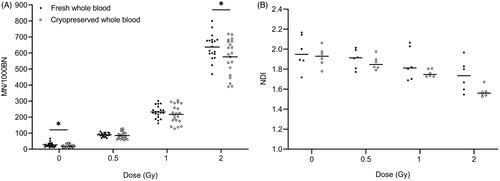
Table 2. Results of the MN assay for fresh and cryopreserved whole blood samples from 20 healthy individuals (A) and from 9 blood samples of one healthy individual, collected over 10 months (B).
Figure 3. Comparison between fresh and cryopreserved whole blood samples from one healthy individual. MN yields from 9 paired samples are shown. Cryopreservation periods range from 7 – 26 weeks. MN yields of irradiated samples represent radiation-induced MN counts.
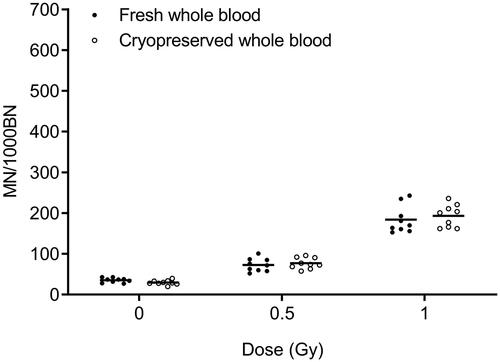
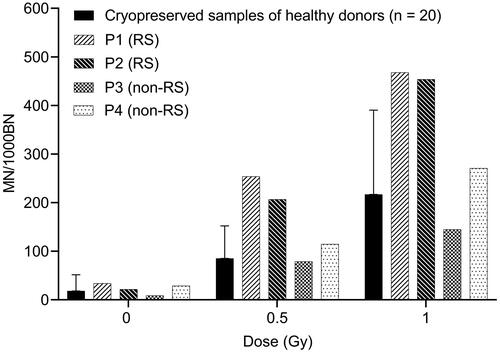
Figure 4. Radiosensitivity analysis in cryopreserved blood samples of four PID patients. MN values are shown for each patient individually. The error bars represent 3SD, indicating the threshold for radiosensitivity. MN yields of irradiated samples represent radiation-induced MN counts. RS: radiosensitive; non-RS: non-radiosensitive.
Data availability statement
The data that support the findings of this study are available from the corresponding author, A.V., upon reasonable request.