
Figures & data
Figure 1. Adapted from Perez-Gelvez et al. (Citation2019). Graphical representation of the methods described in this paper, including data processing, and bioinformatics. FDR: False Discovery Rate. NSAF: normalized spectral abundance factor. B2g: Blast2GO
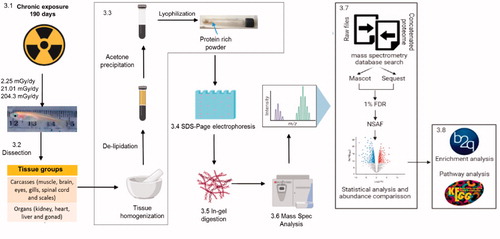
Figure 2. (A) Histologic sections through the gonads and caudal coelomic cavities of medaka from unexposed control (left column) and treatment fish chronically exposed to high dose (204.3 mGy/day) ionizing radiation (right column). In the upper left, mature testicular tissue exhibits a normal progression of spermatogenesis from primary spermatocytes (PS) to mature sperm (S). In the lower left, ovarian tissue contains normal developing pre-vitellogenic (PV) and post-vitellogenic (V) follicles. In the right column, male (upper) and female (lower) gonadal tissue was not identifiable in the coelomic cavities of fish exposed to high dose radiation. Remaining identifiable structures include normal intestine (I), pancreas and adipose (P), and swim bladder (SB). (B) Percentage of individuals with regressed gonads exposed to low (L) 2.25 mGy/day, medium (M) 21.01 mGy/day, and high (H) 204.3 mGy/day for 190 days.
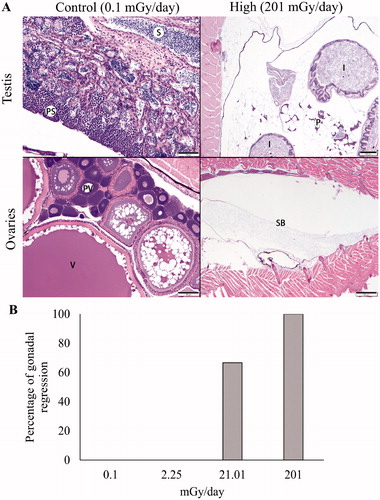
Figure 3. Total proteins identified in Carcasses and Organs after chronic exposure to low levels of IR. Histograms showing the total number of proteins identified in carcasses (A) and organs (C) by label-free approach in 3 levels of IR used and the no-irradiated (0.1 mGy/day) group. Venn diagrams presented the distribution of the proteins identified in each irradiated group and in the non-irradiated group in carcasses (B) and Organs (D). The white circle indicates the number of unique proteins expressed in that group, and the black circle indicates the proteins that were expressed in all the groups. Control: no irradiated group, low: 2.25 mGy/day, medium: 21.01 mG/day and high: 204.3 mGy/day.
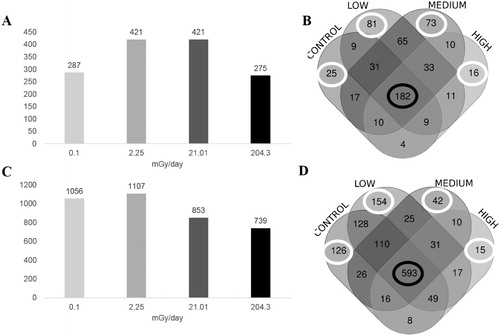
Figure 4. Volcano plot illustrates significantly differentially proteins following 190 days of exposure to low levels of IR relative to control in carcasses (top row) and organs (bottom row) for low: 2.25 mGy/day, medium: 21.01 mGy/day, and high: 204.3 mGy/day. The − log10 (p-value) is plotted against the log2 (fold change: irradiated sample/control sample). Data points in gray denote proteins with insignificant fold changes (<2), while proteins with a fold change >2 but not statistically different from the control are in cyan. Proteins with log2 Fold change that is statistically different from the control samples are highlighted in red. Data points in black represent unique proteins.
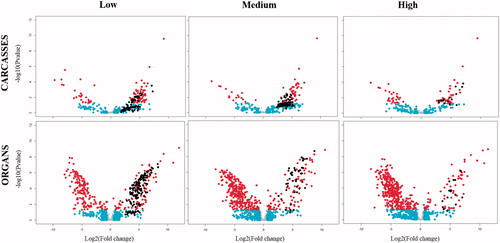
Figure 5. Differential abundant proteins (DAPs) demonstrate enrichment in Molecular Functions. Histograms showing non-redundant one-level hierarchically structured molecular functions biological processes ontology terms from underexpressed and overexpressed proteins in Carcasses (A) and Organs (B), after chronic exposure to low (2.25 mGy/day), medium (21.01 mGy/day), and high (204.3 mGy/day) doses of IR. X-axis shows the percentage of the enrichment of each term in the non-redundant two level hierarchically structured molecular function terms from DAPs, obtained after using CirGO (Supplementary Files S2 and S3). Y-axis shows a non-redundant two level hierarchically GO term corresponding to molecular function.
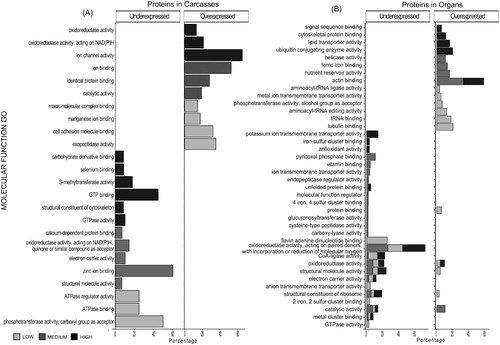
Figure 6. Differentially abundant proteins (DAPs) demonstrate enrichment in biological processes. Histograms showing non-redundant one-level hierarchically structured biological processes ontology terms from underexpressed and overexpressed proteins in Carcasses (A) and Organs (B), after chronic exposure to low (2.25 mGy/day), medium (21.01 mGy/day), and high (204.3 mGy/day) doses of IR. X-axis shows the percentage of the enrichment of each term in the non-redundant two level hierarchically structured Biological processes terms from DAPs, obtained after using CirGO (Supplementary Files S2 and S3). Y-axis shows a non-redundant two level hierarchically GO term corresponding to biological process.
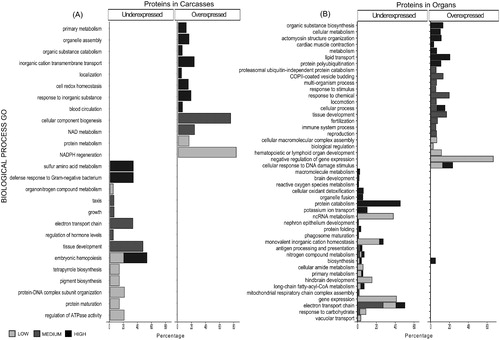
Figure 7. Differential abundant proteins (DAPs) demonstrate enrichment in cellular components. Histograms showing non-redundant one-level hierarchically structured cellular components ontology terms from underexpressed and overexpressed proteins in Carcasses (A) and Organs (B), after chronic exposure to low (2.25 mGy/day), medium (21.01 mGy/day), and high (204.3 mGy/day) doses of IR. X-axis shows the percentage of the enrichment of each term in the non-redundant two level hierarchically structured cellular component terms from DAPs, obtained after using CirGO (Supplementary Files S2 and S3). Y-axis shows a non-redundant two level hierarchically GO term corresponding to cellular component.
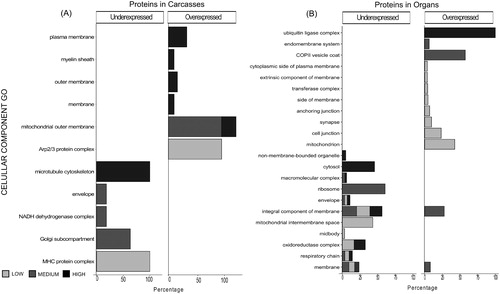
Figure 8. Functional categorization of differentially abundant proteins (DAPs) in carcasses after chronic exposure to IR participated. Y-axis represents the functional categories at the second hierarchy levels with the bar colors indicating the functional categories at the hierarchy levels. X-axis represent the DAPs identified in each dose of IR (low: 2.25 mGy/day, medium: 21.01 mGy/day and high: 204.3 mGy/day). The left portion of the plots indicated the underexpressed proteins, and the right portion indicates the overexpressed proteins. The specifics of each hierarchy, including the proteins, can be found in Table S6.
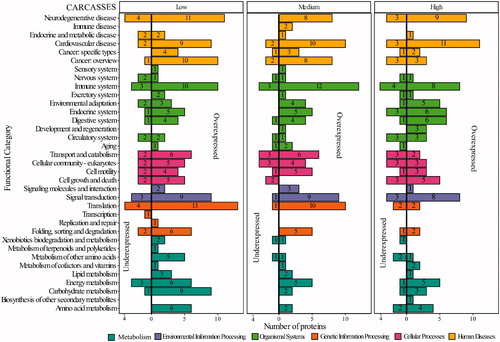
Figure 9. Functional categorization of differentially abundant proteins (DAPs) in Organs after chronic exposure to IR participated. Y-axis represents the functional categories at the second hierarchy levels with the bar colors indicating the functional categories at the hierarchy levels. X-axis represent the DAPs identified in each dose of IR (low: 2.25 mGy/day, medium: 21.01 mGy/day and high: 204.3 mGy/day). The left portion of the plots indicated the underexpressed proteins, and the right portion indicates the overexpressed proteins. The specifics of each hierarchy, including the proteins, can be found in Table S7.
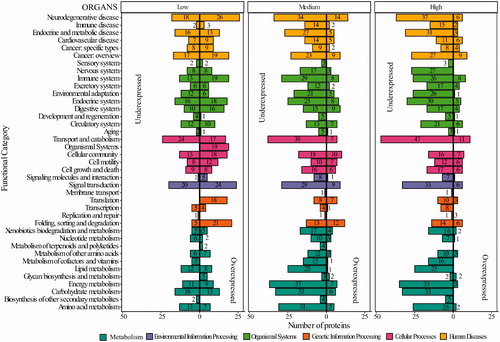
Table 1. Proteins from organs after chronic exposure to low-doses of IR predicted to participate in neurological diseases.
Table 2. KEGG modules affected by chronic exposure to IR at different doses in Organs.