
Figures & data
Figure 1. Key session overview. Structure of the key session ‘Gene expression for biodosimetry and effect prediction purposes: promise, pitfalls and future directions’. Institutions abbreviations after the presenter’s names reflect a shortened version of corresponding affiliations.
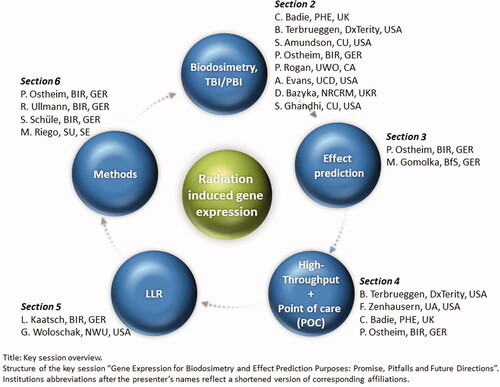
Table 1. Summary of key messages per section and presentation.