Figures & data
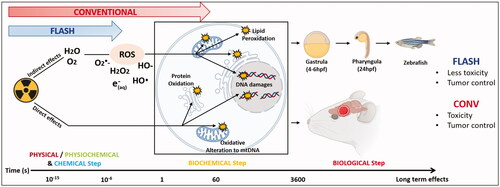
Figure 1. Physico-chemical effects after water exposure to UHDR and CONV. The graph summarizes the early interaction of ionizing radiation with matter that are chemical changes. They have been extensively investigated in the past and are generally described in liquid water, which happens to be a major component of living organisms. Water molecules absorb the majority of the ionizing energy in a process called water radiolysis. The first physical phase is initiated at the time ‘0’ at which the energy is deposited within the target and occurs during the first femtoseconds post-irradiation. Then after picosecond and millisecond, formation of free radicals including reactive oxygen species (ROS) occurs via reactions that form the chemical non-homogenous and homogeneous phases. Experimentally, G°-value can be determined to evaluate the initial yields of reactive species produced during the homogenous stage of chemistry (100 ns to 1 µs). ROS continue to diffuse and interact with soluble substances (like oxygen) at later time points and can then be evaluated as G-values, also named radiolytic yields. Experiments done in water have shown that UHDR produces less H2O2 than conventional irradiation.
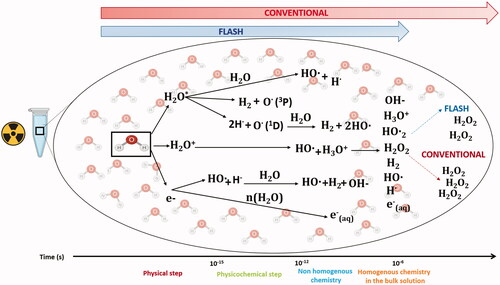
Figure 2. Plasmid DNA as a tool to study DNA damage after CONV vs. UHDR irradiation. The induction of SSB and DSB after irradiation of a supercoiled plasmid releases mechanical constraints in the molecule and causes its spatial conformation to change. These isomers (circular (relaxed) or linear form after SSB or DSB, respectively) have different migration speeds in a gel matrix and are therefore easily separated and quantified by a simple agarose gel electrophoresis (AGE). To investigate the mechanisms underlying the FLASH effect, plasmids can be irradiated dry, or in atmospheric, physiologic or hypoxic aqueous solutions, in presence of various radiosensitizers or scavengers. In addition, several beam parameters such as instantaneous dose, dose per pulse, frequency, and total irradiation time can be investigated.
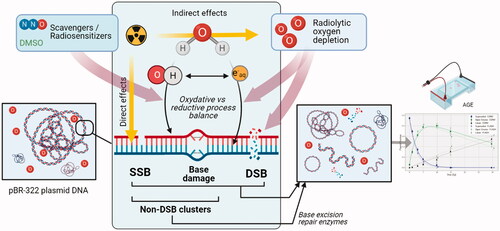
Figure 3. The FLASH effect in normal brain and GBM. Taking the brain as organ-model, this figure shows the cascade of biological events that occur after tissue exposure to conventional dose rate and UHDR. Exposure of the brain to conventional dose rate irradiation (0.1 Gy/s) (left side of the scheme) is associated with early loss of vascular integrity due to endothelial cell damages as well as neuroinflammatory processes involving at longer terms astrogliosis, microglial activation and local immune cell infiltration. This pathogenic process perpetuates in time and ultimately results in neurocognitive disorders associated with loss of neurons and decreased neurogenesis. Interestingly, the delivery of radiation at UHDR (>100 Gy/s) (right side of the scheme) does not activate any of these pathogenic pathways. It spares the vascular network, does not induce neuroinflammation and preserves the neurogenic niche. One possible mechanism to explain the sparing effect of UHDR on normal tissue is the decreased formation of free radicals including reactive oxygen species (ROS) that occurs via early chemical reactions following irradiation (see and ) but other mechanisms can occur and are under investigations. Interestingly, while the normal brain is not damaged by UHDR irradiation, GBM tumor cells are equally sensitive to UHDR and irradiation at conventional dose rate, suggesting that tumor sensitivity is independent on the dose rate. Many factors might be involved in tumor sensitivity to UHDR, including gene expression. A putative susceptibility profile in T-acute lymphoblastic leukemia tumors was related to the expression of GADD45 and FAT1. In contrast, AGAP9 and PDLIM1 expressions seem to be associated to a resistant profile to UHDR (Chabi et al. Citation2020). Furthermore, Spitz et al. proposed another hypothesis explaining the differential impact of UHDR vs. conventional dose rate irradiation on cancer and normal tissue responses (as described in the summary at the end of the biological section).
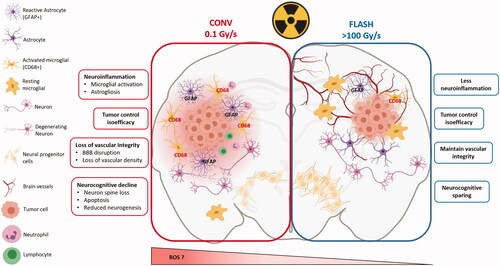
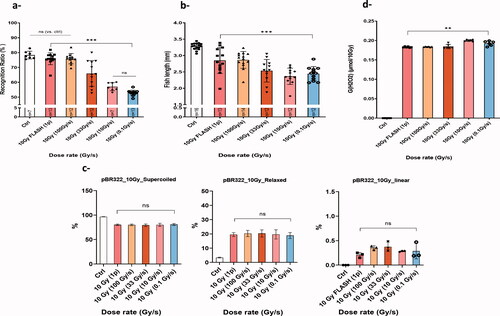
Figure 4. Dose rate de-escalation was performed in mice, zebrafish embryos, plasmid and water using 10 Gy. (a) Recognition ratio (RR) evaluation two months post irradiation for control mice group and groups that received 10 Gy WBI delivery with a dose rate delivered in a single 1.8 µs electron pulse and ranging from (0.1, 10, or 100, 33, 10, 0.1 Gy/s). No memory alteration was observed in the groups irradiated with 100 Gy/s or higher, RR was comparable to the control group. Whereas a significant drop in the RR was observed for the group irradiated at 33 Gy/s. The drop became even slightly larger as the dose rate was further lowered (adapted from Montay-Gruel Citation2017). (b) Wild-type zebrafish embryos were irradiated four hours post fertilization and body length measurement five days post fertilization was used to assess radiation-induced injury. Similarly, with the murine recognition ratio results, both highest dose rates (5.6 × 10⁶ Gy/s and 100 Gy/s) showed less alteration in body length as compared to non-irradiated embryos. Whereas, less protection was observed at lower dose rates and no protection at CONV-RT dose rate. Mean ± SD. p Values derived from Mann–Whitney’s test: *p<.05; **p<.01; ***p<.001 (N = 12–16 embryos/group). (c) Dose rate de-escalation involved irradiation at 10 Gy of pBR322 plasmids in aqueous solutions equilibrated at physiological oxygen conditions (4%). Notably, no difference in DNA damage was measured after UHDR compared to CONV-RT. Mean ± SD. p Values were derived from one-way ANOVA and Tukey’s multiple comparisons test. (d) H2O2 was quantified with the fluorogenic assay AmplexRed after 10 Gy irradiation of water samples equilibrated at 4% O2 following dose rate de-escalation similarly like described in the previous models. The radiolytic yield of H2O2 was significantly lower for the highest dose rates. Whereas, an increase in G(H2O2) was observed when the dose rate is lowered. This differential production reveals a decrease in ROS production following UHDR. Mean ± SD. p Values were derived from Mann–Whitney’s U test: **p<.01.