
Figures & data
Figure 1. Unsupervised hierarchical clustering (Euclidean distance, Ward.D2 algorithm) using prefiltered DNA methylation estimates of all 24 Methyl-Seq experiments. Sample names include treatment (80 kV, 150 kV, DE and NULL) and healthy individuals (G1, G2 and G3). Healthy individuals are color coded in red (G1), green (G2) and blue (G3). The clustering analysis results in individual-specific clusters and a random distribution of the samples within each cluster without clearly distinguishable influence of the treatment.
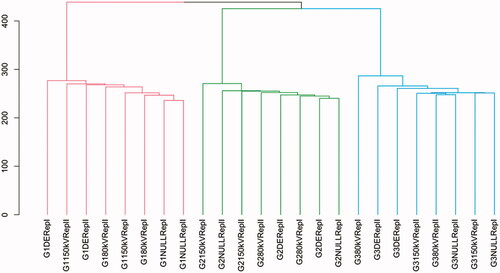
Table 1. Inter-individual differences of DNA methylation and gene expression.
Supplemental material
Supplemental Material
Download MS Word (2.4 MB)Data availability statement
The data that support the findings of this study are available on request from the corresponding author (RU).