Figures & data
Figure 1. Observation of C2C12 proliferation, differentiation, and fusion. (A) Cells were cultured in basal or differentiation condition for 7 days and observed under light microscope (× 100). (B) Cells were cultured in proliferation or differentiation medium for 4 days and revealed by immunostaining with MyoD1, myogenin or myosin antibody (green). Nuclei are labeled using DAPI (blue).
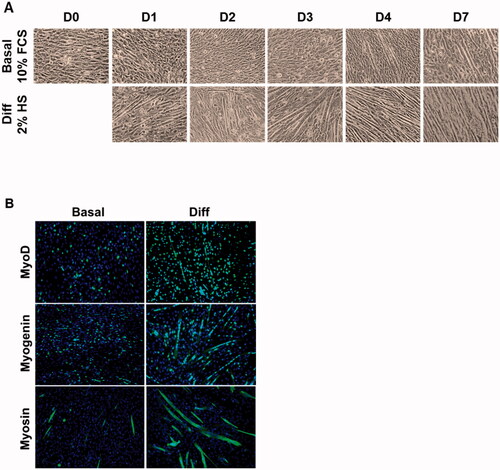
Figure 2. Effects of 5 Gy irradiation on C2C12 proliferation in basal or differentiation conditions. C2C12 cells were grown for 3 days, irradiated and counted 2, 4 and 7 days after irradiation. (A) Cells were counted under microscope or (B) proliferation/viability assay was performed with PrestoBlueTM. *p < 0.05, ** p < 0.01, *** p < 0.001 (ANOVA) denotes (A) the number of cells or (B) the level of absorbance in irradiated C1C12 vs. the same measure in control non-irradiated C2C12.
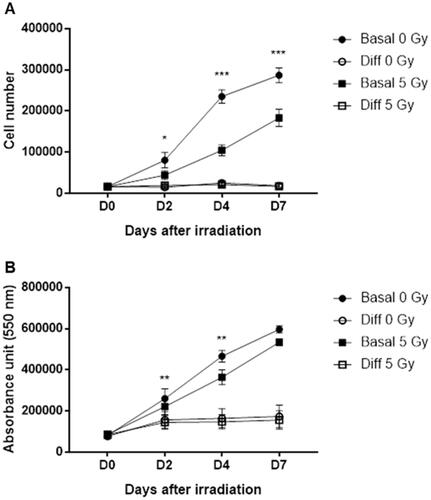
Figure 3. Effects of 5 Gy irradiation over time in basal or differentiation conditions on relative expression of (A) Pax3, (B) MyoG, (C) ENO3. Cells were grown for 3 days prior to irradiation and then cultured in basal or differentiation conditions. RT-qPCR was performed 2, 4 and 7 days after irradiation and the relative expression (2−ΔΔCt) of (A) Pax3, (B) MyoG and (C) ENO3 was measured. Expression is normalized to the HPRT reference gene and to the day 0 condition. (D) Cells were grown 3 days prior to irradiation then cultured in proliferation or differentiation medium for 4 days and revealed by immunostaining with myogenin antibody (green). (E) Western Blot of myogenin was performed with cells cultured in the same way. *p < 0.05, **p < 0.01, ***p < 0.001 (ANOVA) denotes level of absorbance in irradiated C1C12 vs. level in the same condition but non-irradiated C2C12, #p < 0.05, ##p < 0.01, ###p < 0.001 (ANOVA) indicate significant difference between groups below the vertical dotted lines.
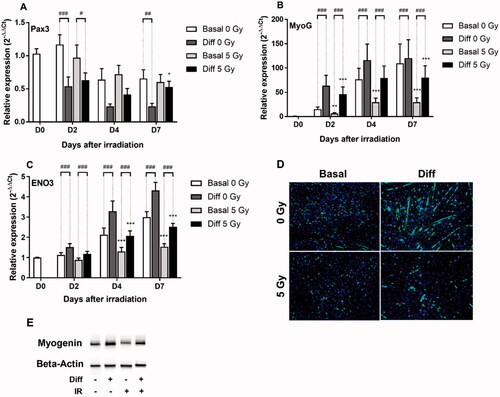
Figure 4. Effects of Hh pathway modulation on cell proliferation in basal condition after irradiation. C2C12 cells were grown 3 days prior to irradiation, then treated with Shh 4 ug/mL or Cyclopamine 3 mM, and 4 days after irradiation proliferation/viability assay was performed with PrestoBlueTM. ***p < 0.001 (ANOVA) denotes level of absorbance in irradiated C1C12 vs. level in control non-irradiated C2C12, #p < 0.05, ##p < 0.01, ###p < 0.001 (ANOVA) indicate significant difference between groups below the vertical dotted lines.
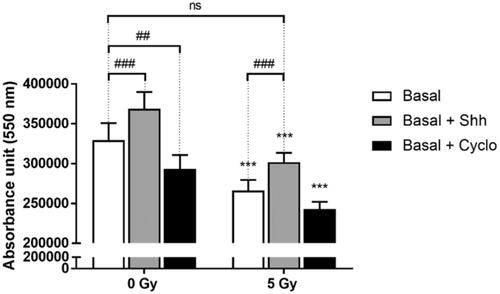
Figure 5. Effects of Hh pathway modulation on cell apoptosis after irradiation. Cells were grown for 3 days, irradiated, and treated with Shh 4 μg/mL or Cyclopamine 3 mM. At day 2, survival analyses were performed using TUNEL technique in basal and differentiation media for cells treated (A) with Shh 4 μg/mL or (B) with Cyclopamine 3 mM. (C) Representative fields obtained in differentiation condition are presented. Apoptotic cells are labeled with Alexa Fluor 488 (green spots) and nuclei with DAPI (blue). Fluorescence microscopy ×100, scale bar = 200 µm. ***p < 0.001 (ANOVA) denotes level of absorbance in irradiated C1C12 vs. level in the same conditions but non-irradiated C2C12, ##p < 0.01, ###p < 0.001 (ANOVA) indicate significant difference between groups below the vertical dotted lines.
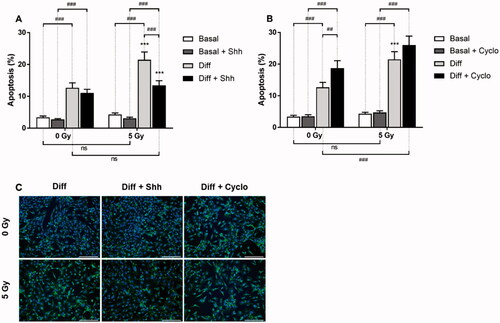
Figure 6. Effect of Hh pathway activation by Shh on C2C12 after irradiation. Cells were grown for 3 days, irradiated, treated with Shh 4 μg/mL and 4 days after irradiation RT-qPCR was performed and relative expression (2−ΔΔCt) of (A) MyoG and (B) MyHC was measured. Expression is normalized to the HPRT reference gene and to the basal 0 Gy condition. (C) WesternBlot of the corresponding proteins was performed with cells cultured in the same way. **p < 0.01, ***p < 0.001 (t-test) denotes level of absorbance in irradiated C1C12 vs. level in the same conditions but non-irradiated C2C12, #p < 0.05, ##p < 0.01, ###p < 0.001 (t-test) indicate significant difference between groups below the vertical dotted lines.
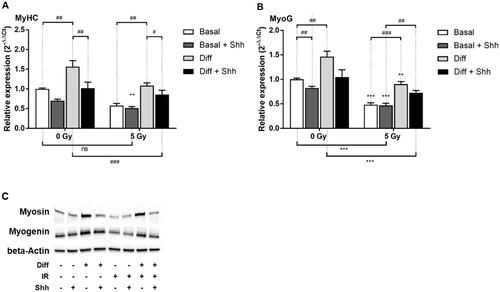
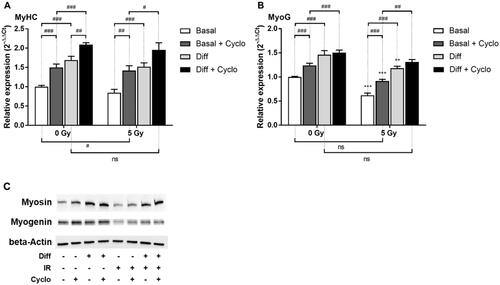
Figure 7. Effect of Hh pathway blockade by Cyclopamine on C2C12 after irradiation. Cells were grown for 3 days, irradiated, treated with Cyclopamine 3 mM and 4 days after irradiation RT-qPCR was performed and relative expression (2−ΔΔCt) of (A) MyoG and (B) MyHC was measured. Expression is normalized to the HPRT reference gene and to the basal 0 Gy condition. (C) Western Blot of the corresponding proteins was performed with cells cultured in the same way. **p < 0.01, ***p < 0.001 (t-test) denotes level of absorbance in irradiated C1C12 vs. level in the same conditions but non-irradiated C2C12, #p < 0.05, ##p < 0.01, ###p < 0.001 (t-test) indicate significant difference between groups below the vertical dotted lines.