Figures & data
Figure 1. Representative example of a dose-response curve and associated benchmark dose outputs.
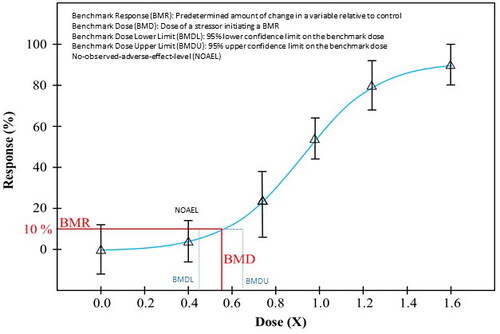
Figure 2. A general work flow demonstrating the use of BMDExpress for genomic dose response analysis. The steps include study design, expression data (data quality control), pre-filtering for dose-response behavior, BMD analysis (selection, parameterization, and characterization of BMD), functional classification (pathway analysis), and biological interpretation (tPOO determination). QC: quality control; ANOVA: analysis of variance; FOR: false discovery rate; ORIOGEN: Order-restricted inference for ordered gene expression; BMD: benchmark dose; EPA: environmental protection agency; BMDS: benchmark dose software; MLE: maximum likelihood estimation; BEPOO: biological effect point of departure (lowest BMD and BMDL of the ‘active’ gene sets); tPOO: transcriptomic point of departure; GO: gene ontology; GSG: general signature genotoxicity.
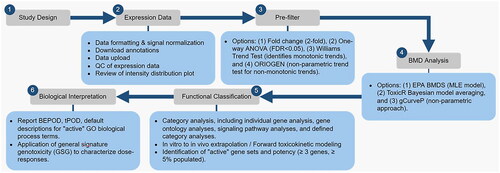
Figure 3. Dose-response evidence used to support key event relationships in adverse outcome pathways may be used to derive benchmark dose values across key events in a pathway to identify correlative BMDs (i.e. early vs late events). KE: key events; BMD: benchmark dose.
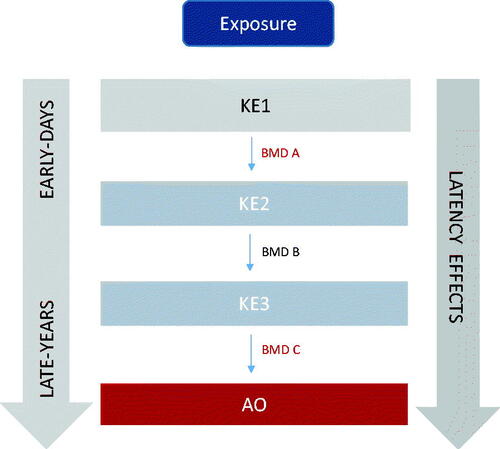
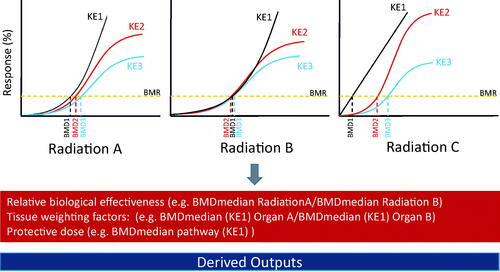
Figure 4. Schematic showing how key events in an adverse outcome pathway can be the basis of experimental design and data interpretation using the BMD approach and provide information on relative biological effectiveness, tissue weighting factors and the protective dose. AOP: adverse outcome pathway; KE: key events; BMD: benchmark dose. Additional details on derived outputs can be found in Chauhan et al. (Citation2016).