
Figures & data
Table 1. Summary of radiation mutagenesis at 7 specific loci in mouse oocytes.
Figure 1. A) A schematic view of mouse ovary at day 21 after birth (Hayashi et al. Citation2020). B) A close view of mouse ovary at day 14 after birth. Note that one primary follicle (PrF) started to grow at a place very close to the ovarian surface (Choi et al. Citation2008). PF stands for primordial follicle, SF secondary follicle, and AF antral follicle.
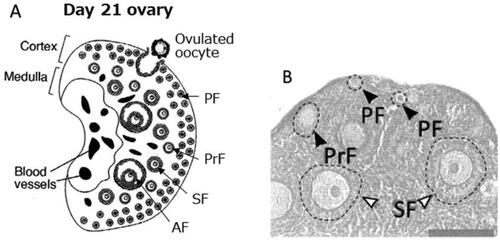
Figure 2. Cortical region of an ovary at an age of 23 (A) and 37 (B) years. Note blood vessels are scarce when young but increased its density with the increase of age (open arrows). Black arrows indicate resting oocytes. Bar represents 80 µm. (Delgado-Rosas et al. Citation2009).
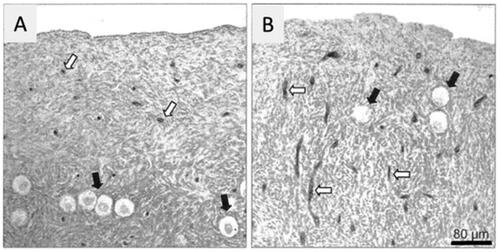
Figure 3. A) A cross section of an ovary of young woman. The small white dots located close to the ovarian surface are the resting oocytes. A line was added to the photo to indicate the boundary between the cortex and stroma. Original photo is colored (Silber Citation2015). B) Fibrous ovarian cortex removed for cryopreservation of resting oocytes (Silber Citation2016).
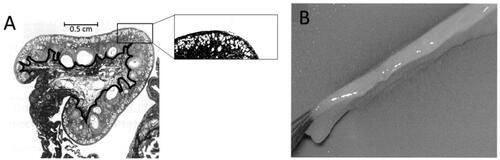
Figure 4. Different mutation induction rate in different genes (UNSCEAR Citation2001). The black bars indicate 7 genes used for the initial SLT studies and white bars represent genes examined in later studies. The three dotted lines indicate, starting from the top, the mean mutation induction rate for 7 genes, 34 genes, and 1,190 DNA fragments.
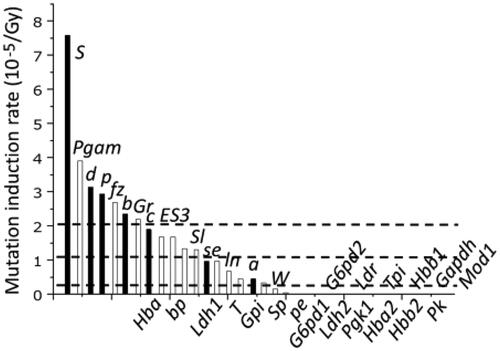
Table 2. Results of the mean induction rate of deletion mutations for over one thousand genomic DNA fragments that were end-labeled with 32P at NotI sites (Asakawa et al. Citation2004, Citation2013).
Figure 5. Mapping of haplo-sensitive genes on human chromosomes.
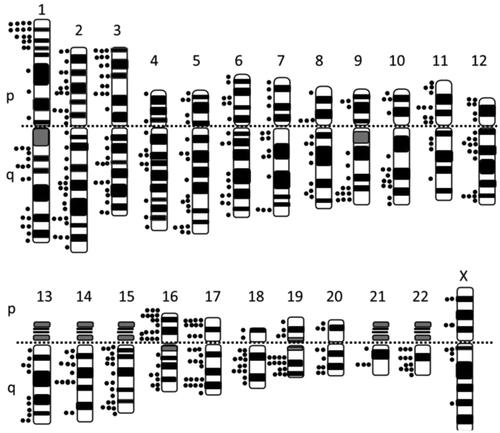
Figure 6. Estimated frequency of dominant diseases/haploinsufficiency disorders in offspring derived from 1 Gy-exposed spermatogonia but without considering possible decreased viability. The frequencies of other genetic changes are also shown for comparisons. Dominant mutations include bone malformations, cataracts, and congenital malformations.
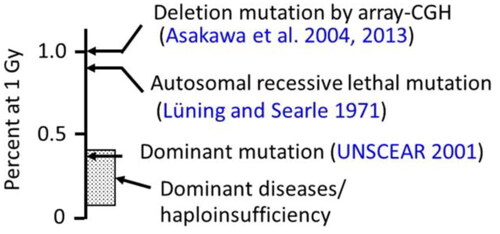
Figure 7. A) Schematic view which indicates development of male germ cells in the seminiferous tubules (Jung et al. Citation2019). B) A proposed model for the location of mouse spermatogonia stem cells (SSCs) close to the basement membrane in the seminiferous tubules, and away from blood vessels (BV) (Lord and Nixon Citation2020).
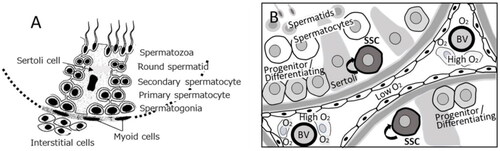
Figure 8. A) Mouse testis at 12 weeks of age (hematoxylin-eosin staining). Sg stands for spermatogonia, SC for Sertoli cells, and L for Leydig cells. Bar represents 20 µm. (Guillermet-Guibert et al. Citation2015). B) Human testis stained with an anti-MYH11 (a smooth muscle myosin) antibody. Arrow heads indicate blood vessels, and the insert indicates negative results with a control antibody. Bar represents 50 µm (Welter et al. Citation2013). C) A schematic presentation of stem cell pools and sperm output in mice and humans (Fayomi and Orwig Citation2018).
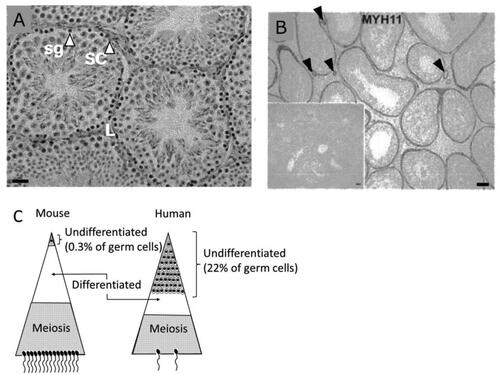
Figure 9. Dose survival responses of spermatogonia in mice (A) (Erickson Citation1981) and humans (B) (Clifton and Bremner Citation1983). Ais and Acl stand for isolated and clonally aligned A spermatogonia, respectively, in mice.
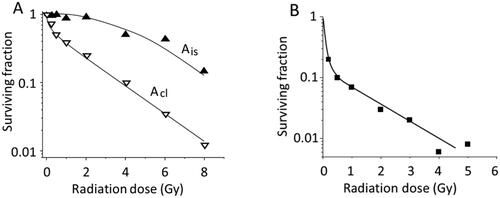
Figure 10. A) Results of specific locus tests of mouse spermatogonia after exposures of acute X- or gamma-rays (□) or 500 R + 500 R fractionated exposures given 1 day apart (■). B) Results after acute (■) or chronic (□) exposures of fission neutrons (Searle Citation1974).
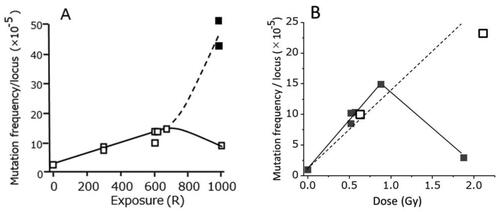
Table 3. Epidemiologic data in the offspring of Wilms tumor survivors (Green et al. Citation2010).