
Figures & data
Figure 1. Experimental setup of all three experiments performed in this study. Experiment 1 examined the influence of delayed sample processing up to 4 h at the ward prior to transport to specialized laboratories. In experiment 2, three different simulated transport conditions were additionally investigated for up to 24 h, and experiment 3 examined the influence of additional irradiation using the best conditions from experiment 2.
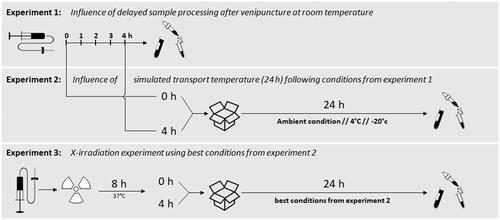
Table 1. Quantity and quality results of isolated RNA and housekeeping gene expression copy number results (18S rRNA raw Ct-values) of experiment 1. The sample in bold (0 h RT) refers to the reference sample for statistical analysis. Abbreviations: ns = not significant, RINe = RNA integrity number equivalent, Ct = cycle threshold, RNA = Ribonucleic acid, rRNA = ribosomal RNA, SEM = standard error of the mean.
Figure 2. Differential gene expression results of experiment 1 are depicted for FDXR, DDB2, POU2AF1, and WNT3. The immediately processed sample after venipuncture was used as the reference sample. Symbols represent the mean, and the error bars show the standard error of the mean (n = 3). the grey area refers to a two-fold difference in gene expression from the reference sample to adjust for the methodological variance of qRT-PCR. Abbreviations: EDTA = ethylenediaminetetraacetic acid; qRT-PCR = quantitative real-time polymerase-chain-reaction.
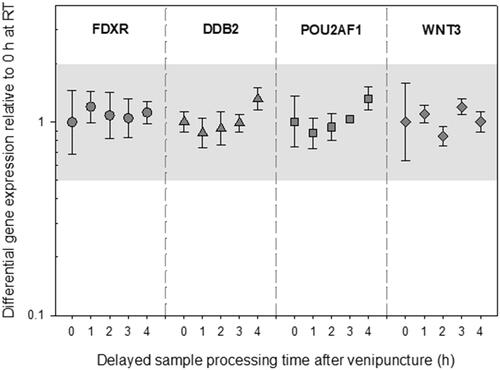
Table 2. Quantity and quality results of isolated RNA and housekeeping gene expression copy number results (18S rRNA raw Ct-values) of experiment 2. The simulated transport condition in bold refers to the reference sample for statistical analysis. Significant results are marked in bold letters (p < 0.05). Abbreviations: ns = not significant, RINe = RNA integrity number equivalent, Ct = cycle threshold, RNA = Ribonucleic acid, rRNA = ribosomal RNA, RT = room temperature, SEM = standard error of the mean.
Figure 3. Differential gene expression results of experiment 2 are shown for FDXR, DDB2, POU2AF1, and WNT3. The immediately processed sample after venipuncture was used as the reference sample. Symbols represent the mean, and the error bars show the standard error of the mean (n = 3). the grey area refers to a two-fold difference in gene expression from the reference sample to adjust for the methodological variance of qRT-PCR. P-values 0.01–0.05 are marked with one asterisk and refer to significant differences relative to the reference sample. Abbreviations: qRT-PCR = quantitative real-time polymerase-chain-reaction; RT = room temperature.
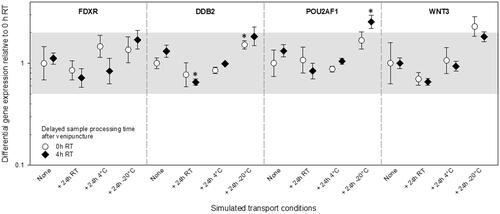
Table 3. Quantity and quality results of isolated RNA and housekeeping gene expression copy number results (18S rRNA raw Ct-values) of experiment 3. The simulated transport condition in bold refers to the reference sample for statistical analysis. Abbreviations: ns = not significant, RINe = RNA integrity number equivalent, RNA = Ribonucleic acid, rRNA = ribosomal RNA, Ct = cycle threshold, RT = room temperature, SEM = standard error of the mean.
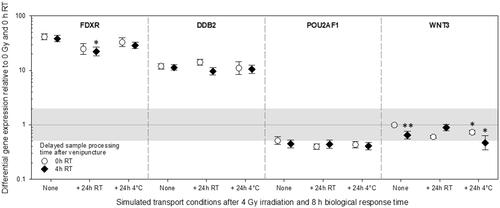
Figure 4. Differential gene expression results of experiment 3 are shown for FDXR, DDB2, POU2AF1, and WNT3. Immediately after venipuncture processed unirradiated samples were kept at room temperature for 0 h and used as the reference sample and set to one (horizontal black line). the grey area refers to a two-fold difference in gene expression from the reference sample to adjust the methodological variance of qRT-PCR. Symbols represent the mean, and the error bars show the standard error of the mean (n = 5). P-values 0.01–0.05 and 0.0001-0.001 are marked with one and two asterisks and refer to significant differences relative to samples after an 8 h biological response time immediately processed after venipuncture (0 h RT, None). Abbreviations: qRT-PCR = quantitative real-time polymerase-chain-reaction, RT = room temperature.
Supplemental Material
Download MS Excel (98.5 KB)Data availability statement
The authors confirm that the data supporting the findings of this study are available within the article and its supplementary materials.