
Figures & data
Figure 1. AUC organisational structure.
Source: Own compilation, based on decision made at the 34th Ordinary Session of the AU Assembly in February 2021.
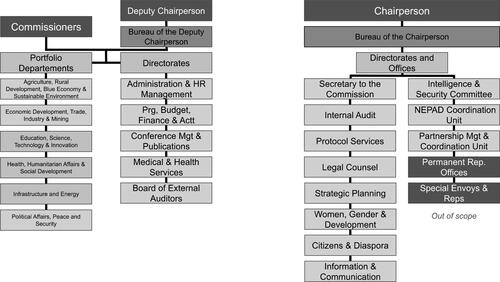
Figure 2. AUC staff structure.
Source: Own compilation, based on data submitted to PRC Sub-Committee on Structural Reforms.
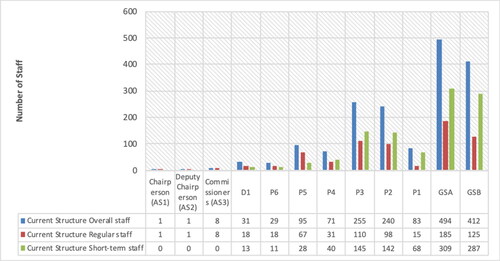
Table 1. Summary and operationalisation of the actor-level typology.
Table 2. Distribution of response rate in our survey, by staff categories.
Table 3. Task profile: Distribution of officials spending much or very much time on the following tasks (Percentages)*.
Table 4. Contact patterns: Distribution of officials having often or very often contacts with the following (percentages)*.
Table 5. Distribution of officials’ perceiving the following considerations and concerns as fairly or very important (percentages)*.
Table 6. Distribution of officials who report the following institutions provide fairly or very important arguments (percentages)*.
Table 7. Role perceptions: Distribution of officials identifying much or very much with following roles (percentages)*.
Table 8. Distribution of officials who very much or much agree that policy proposals reflect the following (percentages)*.
Table 9. Cleavages of conflict: Distribution of officials who much or very much report the following conflicts (percentages)*.
Table 10. Patterns of coordination: Distribution of officials reporting very much or much efficiency in coordination between the following (percentages)*.