
Figures & data
Table 1. Construction of the Vineyard Geologic Identity (VGI).
Figure 1. Location map of the study area. Inset shows the states of Vermont (VT) and New York (NY) in the northeastern United States. Larger figure presents the locations of the LP and SV study sites (stars) in the Champlain Valley. Color shading represents the mapped extent of proglacial Lake Vermont at its highest (Coveville) level, and its lowest (Fort Ann) level, as well as the extent of the Champlain Sea marine incursion. Note that both sites were submerged by Lake Vermont at the Coveville level, but only the SV site was submerged by the Fort Ann Lake Vermont and the Champlain Sea. Blue denotes the extent of modern Lake Champlain. ‘BTV’ is the Burlington International Airport where the local climate record was collected.
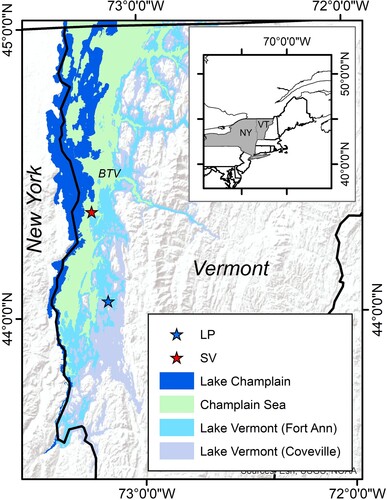
Figure 2. Maps of the LP (left) and SV (right) study sites. Background is a 0.7-m lidar dataset hillshaded and colored to enhance topography. Note that the range of elevations is different for the two sites. White lines delineate mapped soil series downloaded from the Web Soil Survey (https://websoilsurvey.sc.egov.usda.gov). Am is the Amenia series, Hn the Hinesburg, and Su the Stockbridge (see Table S1). Pink boxes outline the study sites in the Marquette block at each vineyard. Pink dots are the locations of the 20 auger holes (10 per site) where samples were collected. Arrow points to the natural gully at the north end of the SV site where additional samples from deeper sediment were obtained.
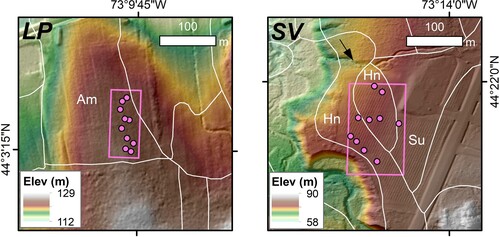
Figure 3. Boxplots of measured soil fertility data grouped by study site. P-values for differences were determined with a non-parametric Mann-Whitney U-test. ‘A’, ‘B’, and ‘Till’ denote the values measured for the three deep samples collected from the gully at the SV site ().
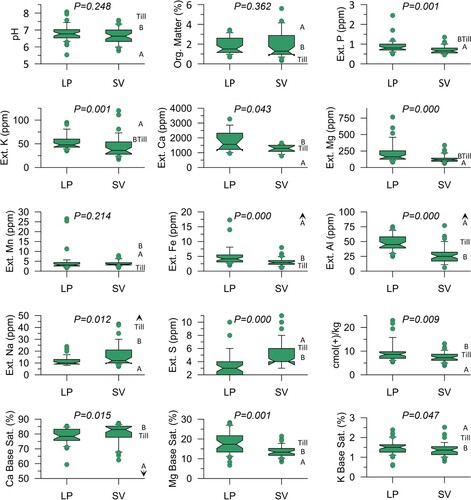
Figure 4. Representative results from thermogravimetric analysis (25–1000°C) for samples LP-3 and SV-5 at four different depths. Dashed line displays mass loss, whereas solid orange line displays the first derivative of mass (dWeight). The major peaks identified include H2O-water, OM-organic matter, KIC-kaolinite/illite/chlorite, Mag-magnesite, Cal-calcite.
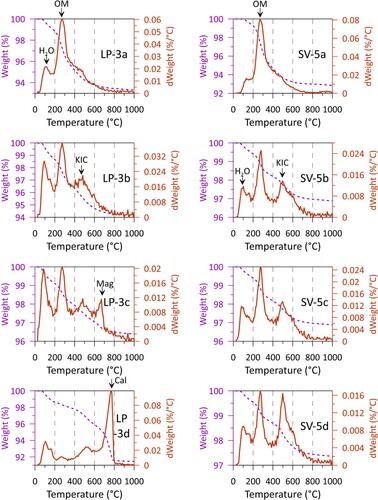
Figure 5. Conductivity maps of the LP and SV sites (UTM Zone 18N). Data were collected along transects shown by the dotted gray lines. Labeled white circles are the locations of the auger holes where soil samples were collected. The color scale in the background represents conductivity values across each study interpolated by a kriging function. Note the greater scale range at the SV site.
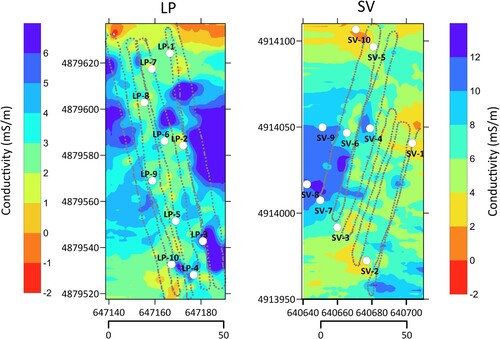
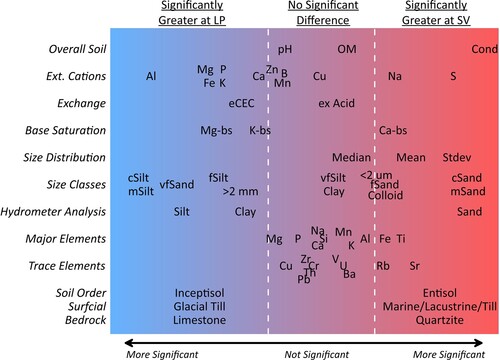
Figure 6. Visual representation of the VGI ‘fingerprint’ distinguishing the LP and SV sites. Basic site characteristics are presented at the bottom, and groups of measured geochemical, grain size, and soil fertility metrics are presented above. The two dashed white lines represent the significance threshold (p = 0.050); metric plotted to the left of the left line are significantly greater at LP, whereas those to the right of the right of the right line are significantly greater at SV. Metrics plotted between the two dashed lines exhibit no significant difference between the two sites.
Supplemental Material
Download Zip (1.9 MB)Data availability statement
The samples analyzed in this study were collected from private vineyards with the understanding that the raw data not be published. Contact the author for details.