Figures & data
Table 1. Questionnaire participants: number of parents and guardians in each academic year.
Figure 1. A sample of daily class photo documentation: on 6 December 2016 for a class of five-to six-year-olds.
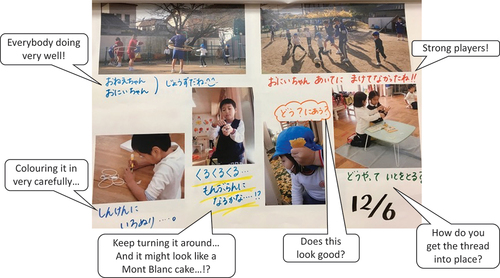
Table 2. Numbers of classes that participated in this project.
Figure 2. Episode 1 photos: three-to-four-year-old children.
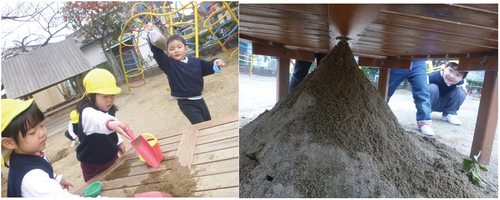
Figure 3. Episode 3 photo: five-to-six-year-old children.
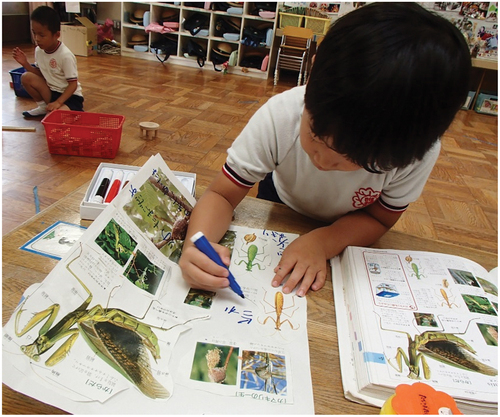
Figure 4. A two-year comparison: how the documentation affects parents’/guardians’ interactions (n = 72).
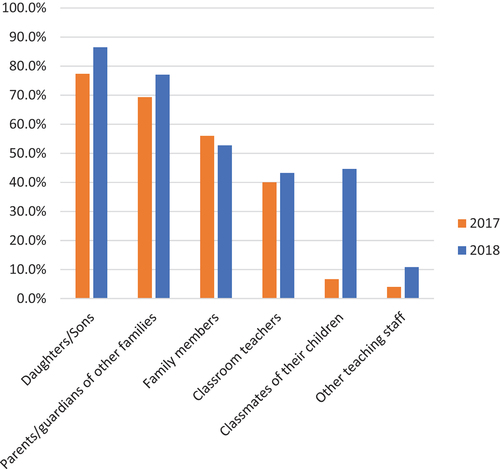
Table 3. Descriptive statistics of the questionnaire for parents/guardians (n = 179).
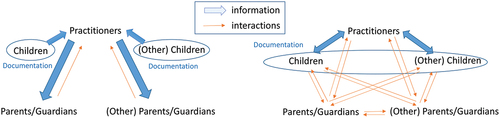
Figure 5. Processes of communication afforded by pedagogical documentation.