
Figures & data
Table 1. Size, number of active US-listed firms, and countries represented in the four unhealthy commodity industries selected for analysis, 2019.
Figure 1. Aggregated effective tax rates for public US-listed corporations in four unhealthy commodity industries, 1960 to 2019.
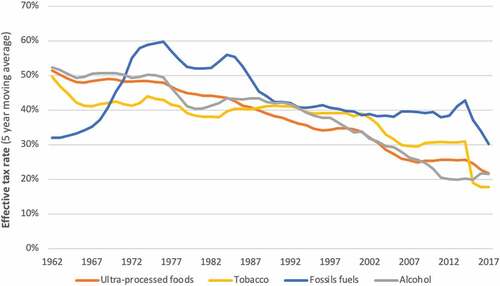
Figure 2. Distribution of consumption according to total retail sales revenue (real values) generated from ultra-processed foods, alcohol, and tobacco products, 2007–2019.
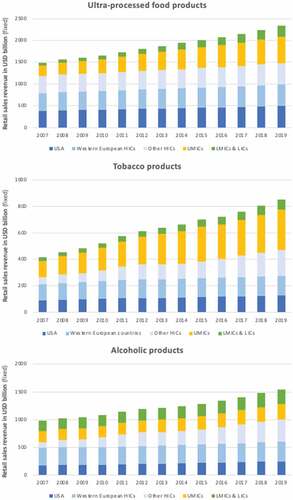
Figure 3. Wealth transfers to shareholders (adjusted values) and the shareholder value ratios of public US-listed corporations active in the four unhealthy commodity industries, 1960–2019.
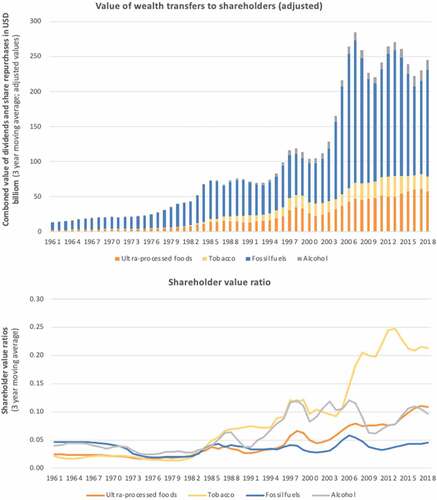
Table 2. Traded share ownership of the top five firms in each industry, disaggregated by investor country of origin, 2021.