Figures & data
Figure 1. Hypothesized model.
Notes. In Study 1, POS and sex were measured at T1, adjustment was measured at T2 (while controlling for adjustment at T1). Commitment was measured at T2. In Study 2, OCQ, FSOP, sex, adjustment, commitment, career satisfaction, and community embeddedness were measured at T1.
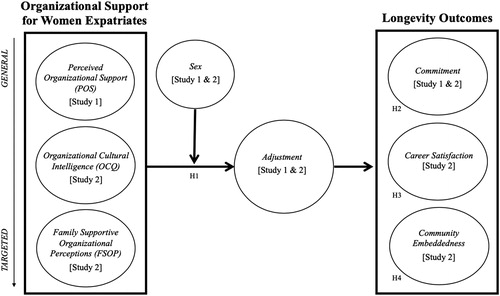
Figure 2. Relationship between perceived organizational support (POS) and adjustment as moderated by sex in Study 1.
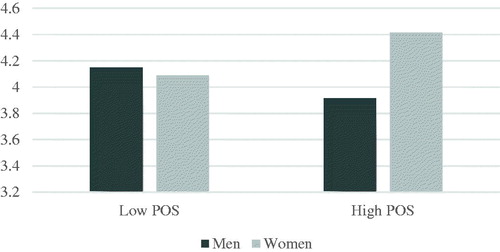
Table 1. Descriptive statistics and correlations for Study 1 by sex.
Table 2. The effects of perceived organizational support on commitment, as mediated by adjustment and moderated by sex in Study 1.
Table 3. Descriptive statistics and correlations for Study 2 by sex.
Table 4. The effects of organizational cultural intelligence and family supportive organizational perceptions on commitment, career satisfaction, and community embeddedness as mediated by adjustment and moderated by sex in Study 2.
Table 5. Summary of the indirect effects of perceived organizational support (Study 1), organizational cultural intelligence (Study 2), and family-supportive organizational perceptions (Study 2) by sex.
Figure 3. Relationship between organizational cultural intelligence (OCQ) and adjustment as moderated by sex in Study 2.
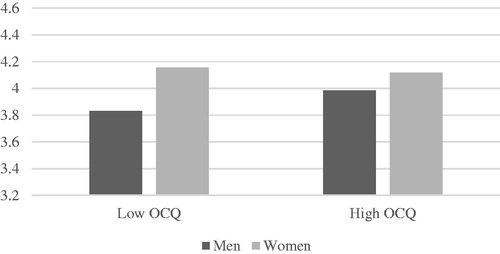
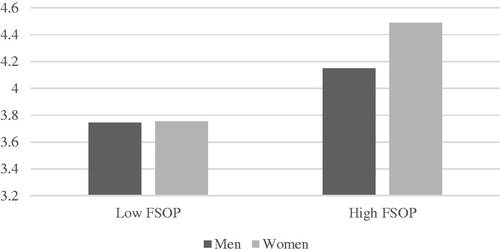
Figure 4. Relationship between family-supportive organizational perceptions (FSOP) and adjustment as moderated by sex in Study 2.