
Figures & data
Table 1. Factor loadings for the Resilience scale for the UK and Italian sample.
Table 2. Factor loadings for the Stress scale for the UK and Italian sample.
Table 3. UK – Italy: the composite reliability, average and maximum-squared variance.
Figure 1. Path model.
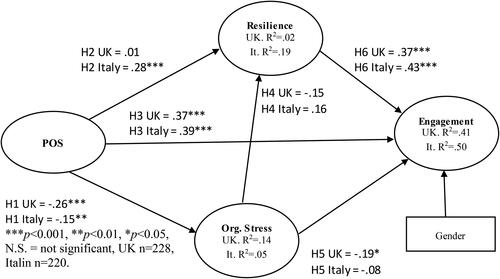
Table 4. Mean comparison: UK to Italy.
Table 5. Direct and indirect effects.