Figures & data
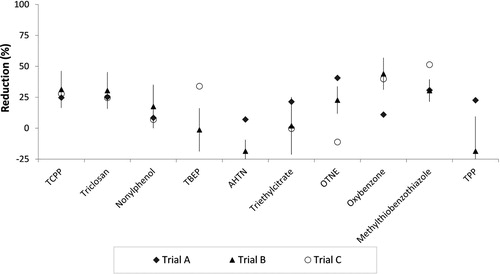
Figure 1. Simplified schematic overview of the experimental setup at Klagshamn WWTP.1: Return activated sludge basin of treatment line one 2: Submerged centrifugal pump, 3: Flow meter, 4: Venturi injector, 5: Pressurized reaction vessel (7.9 m3, HRT: ∼18 min), 6: Sample point, 7: Aerated basin of treatment line one.
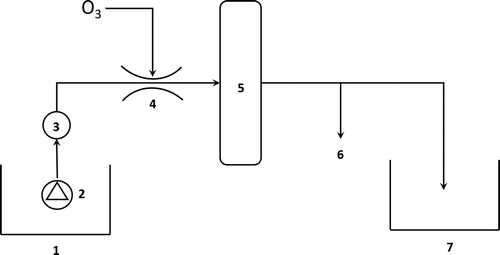
Table 1. Analysed MPs.
Table 2. Sludge characteristics before and after ozone addition.
Table 3. Characteristics of the sludge as assessed in the quantitative and semi-quantitative microscopy evaluations.
Figure 2. Live/Dead® fluorescence microscopy images of the untreated (control) and ozone treated return activated sludges (A–C).
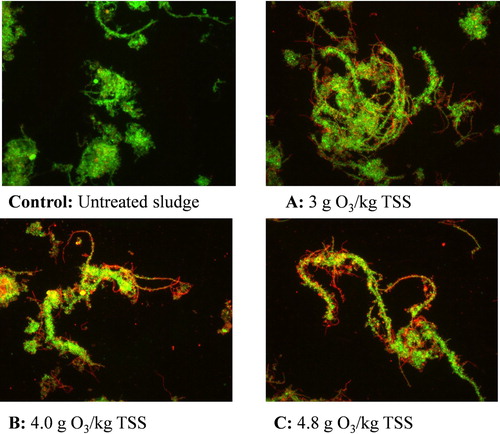
Figure 3. The accumulated methane production (NmL CH4/g VSin) during the course of the anaerobic digestion trial with standard deviations.
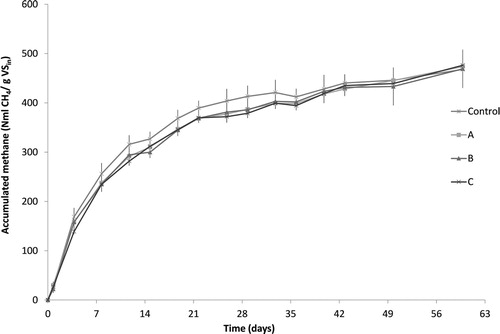
Figure 4. The reduction of 10 MPs in trials (A–C) compared to the control with standard deviations from trial B.