Figures & data
Table 1. TS, VS and COD of the thickened and digested sludge from Luleå sewage treatment plant from a sample taken after performing the experiments.
Table 2. Elemental analysis of the used fly ash.
Table 3. Gas analyses showing the methane to carbon dioxide ratio and hydrogen sulphide content of produced biogas in experiments with and without ash addition.
Figure 1. Accumulated methane production of the thickened sludge of two screening-test experiments as examples.
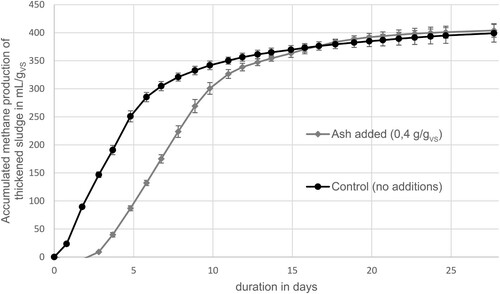
Table 4. pH levels and EC measurements at the beginning and end of experiments with and without ash addition.
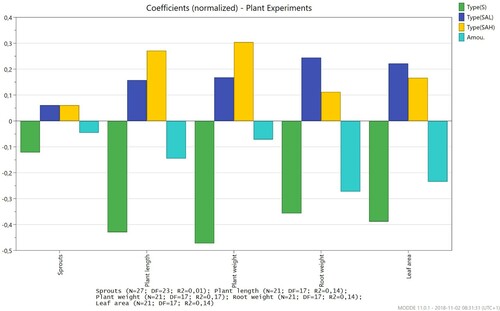
Figure 2. Normalized coefficients of MODDE, showing how different types of sludges affected plant growth.