
Figures & data
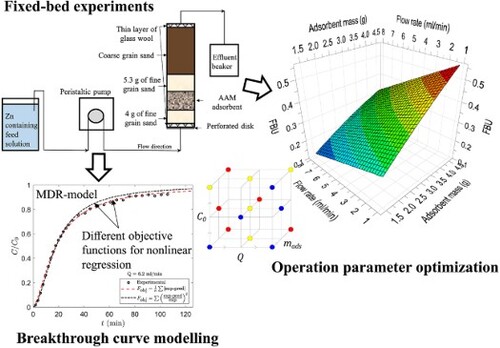
Table 1. The operational factors and their levels.
Figure 1. Illustration of the experimental setup.
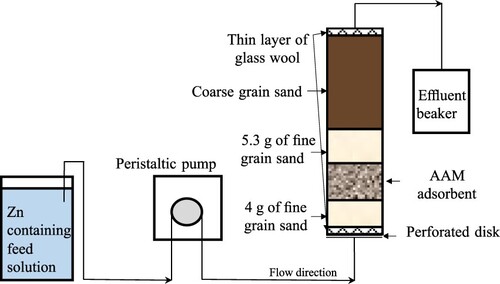
Table 2. Results of the SSA, PV and PSD analyses. See ESI for a description of the analyses.
Table 3. The experimental design and the observed response values. The experiments were performed in the order given in the second column.
Table 4. Summary of fit for the five studied responses.
Figure 2. The effects of factors to the responses according to Equations (16)–(19). The limits of the 95% confidence intervals are indicated by the curves with red dots.
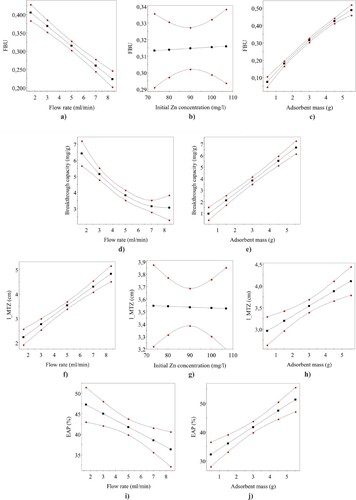
Figure 3. Experimental BTCs from experiments 13, 14 and 18 with differing bed heights () other conditions being the same.
90 mg/l and
5 ml/min. Effluent pH 4.9–5.5.
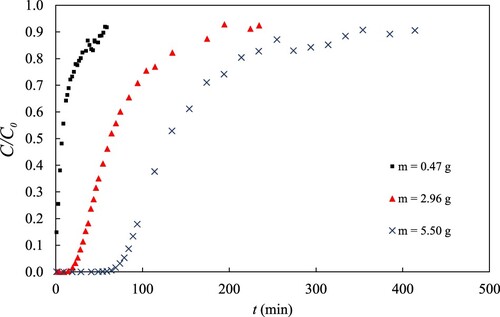
Figure 4. The BTC from experiment 18 and the curves fitted with the logistic, MDR, and Chu models. Equation (13) has been used as the objective function in nonlinear regression. 5 ml/min,
90 mg/l and effluent pH
5.2.
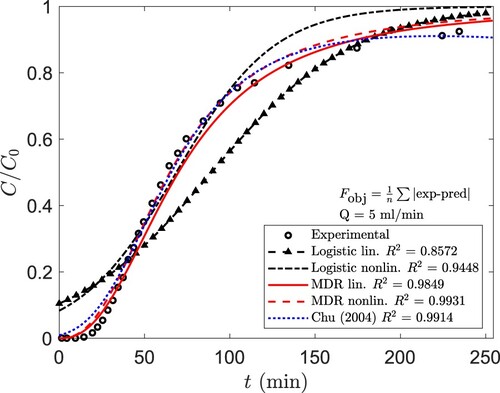
Figure 5. Comparison of the curves fitted to the BTC data from experiment 18 using nonlinear regression with different objective functions. (a) Logistic model, (b) MDR model and (c) Chu model.
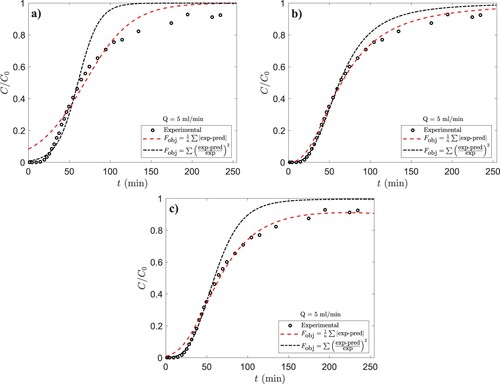
Table 5. Experimental values and the values calculated from the fitted MDR equations. The type of regression is given in the column header.
Table 6. Experimental values and the values calculated from the fitted MDR equations. The type of regression is given in the column header.
Table 7. Comparison of the maximum experimentally obtained column saturation capacity () in this study to column capacities reported for other adsorbents.