
Figures & data
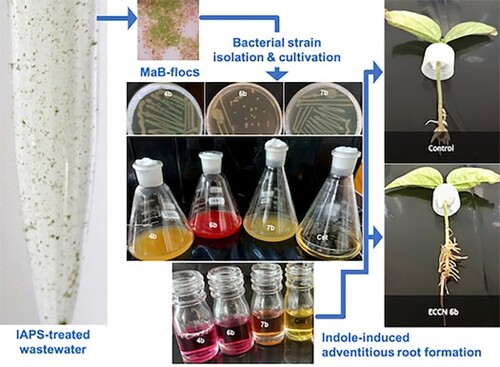
Figure 1. Scanning electron micrographs showing cell morphology of the twelve bacterial isolates obtained from HRAOP MaB-flocs. ECCN 1b (A); ECCN 2b (B); ECCN 3b (C); ECCN 4b (D); ECCN 5b (E); ECCN 6b (F); ECCN 7b (G); ECCN 8b (H); ECCN 9b (I); ECCN 10b (J); ECCN 11b (K) and ECCN 12b (L).
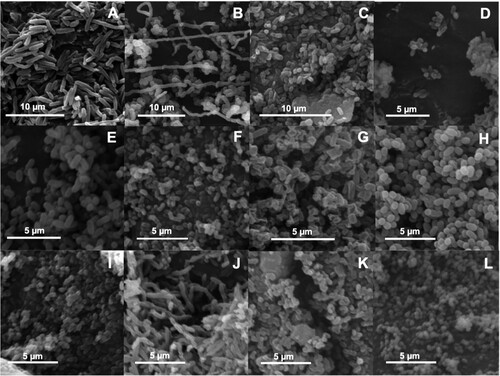
Table 1. Morphological and biochemical characteristics of bacterial colonies of isolates obtained from MaB-flocs formed in the HRAOP of an IAPS supplied municipal sewage.
Table 2. Molecular identity of bacteria isolated from MaB-flocs formed in HRAOP of the Belmont Valley IAPS supplied municipal sewage.
Figure 2. Dendrogram showing the genetic relationship between the twelve potential PGPR strains (♦) isolated from MaB-flocs generated in HRAOP and reference strains contained in the GenBank database. Assigned strains and GenBank accession numbers are located to the right of each strain. Bootstrap test (1000 replicates) above branches, bootstrap values ≥56% at nodes and bar, substituting 5 nucleotides per 100.
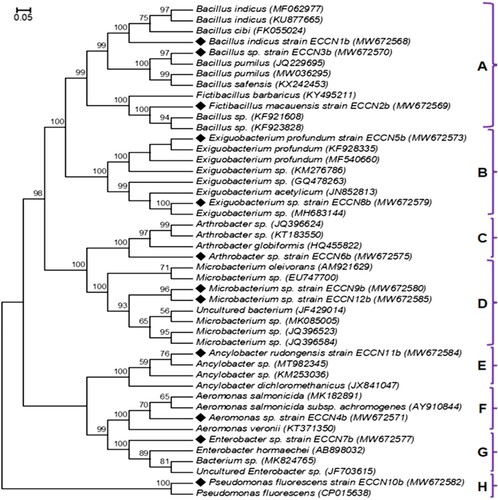
Figure 3. Potential plant growth regulator production and essential nutrient mineralization by bacterial strains isolated from MaB-flocs produced in mixed liquor of the HRAOP of an IAPS supplied municipal sewage. Estimates of indole production (A); ammonium production (B); solubilised phosphate (C); and, solubilised potassium (D) by these bacterial isolates in stationary phase (OD600 = 0.4 at 30°C) were determined spectrophotometrically. Results are the mean ± S.D. Means denoted by a different letter indicate significant differences (p < 0.05).
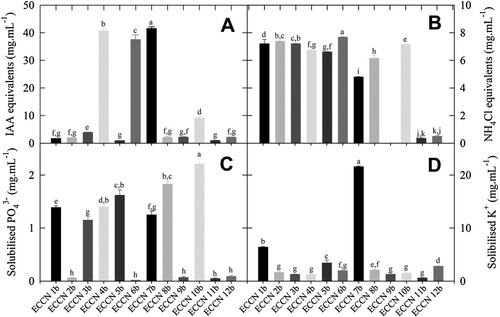
Table 3. Ranking of novel bacterial strains according to PGP activity potential. Strains were isolated from MaB-flocs in mixed liquor of the HRAOP of an IAPS supplied municipal sewage.
Figure 4. Adventitious root formation in mung bean hypocotyls by cell-free filtrates from Aeromonas ECCN 4b, Arthrobacter ECCN 6b, and Enterobacter ECCN 7b grown in L-trp-supplemented medium. Indole production, measured as IAA equivalents, as a function of L-trp concentration (A); adventitious roots formed in mung bean hypocotyls treated either with IAA or cell-free bacterial filtrate (B); kinetics of adventitious root formation in mung bean hypocotyls treated either with IAA or cell-free bacterial filtrate (C); and, fresh and dry mass of the adventitious roots formed (D). Results are the mean ± S.D. Means followed by ** indicate significant differences from control + and the cell-free bacterial filtrate treatments (p < 0.05).
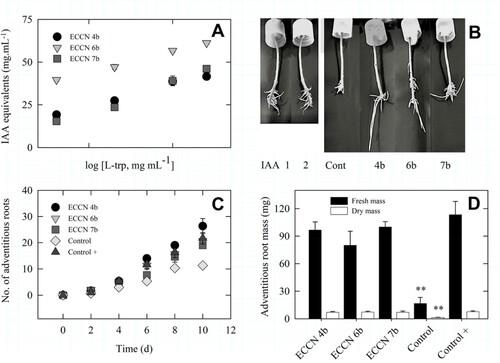
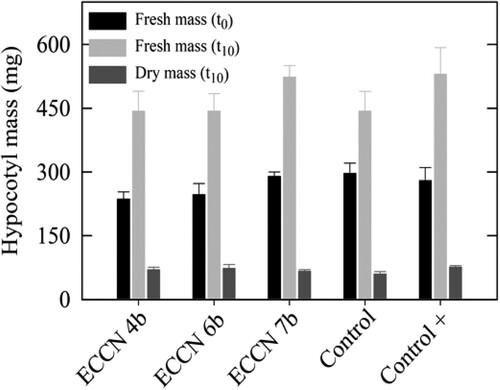
Figure 5. Fresh and dry mass of mung bean hypocotyls treated either with IAA or cell-free culture filtrates from L-trp-supplemented cultures of Aeromonas ECCN 4b, Arthrobacter ECCN 6b, and Enterobacter ECCN 7b. Initial fresh mass (FMt0) was determined at start of the experiment (t0) while final fresh mass (FMt10) and dry mass (DMt10) were determined after a 10-d incubation period (t10). Results are the mean ± S.D. (p < 0.05).
Data availability
Data will be made available on request.