
Figures & data
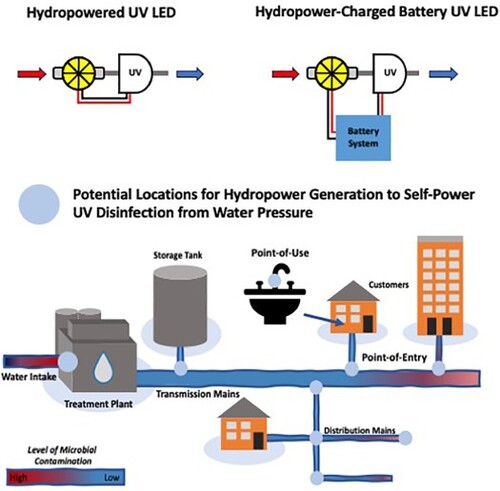
Figure 1. Schematic of water pressure harvesting with hydroelectric systems in drinking water and wastewater pipe systems.
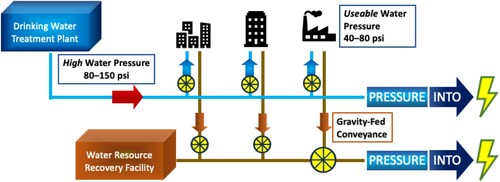
Figure 2. Proof-of-concept for off-the-shelf hydropower UV LED reactor (A) attached to sink for visualisation purposes. Flow through testing apparatus (B) with three different power regimes: wall-plug, hydropower, and hydropower-charged battery. A valve (V) was used for adjusting the flow rates. The dashed lines indicate the systems that were interchanged into the test apparatus to change the power supply for flow through disinfection testing.
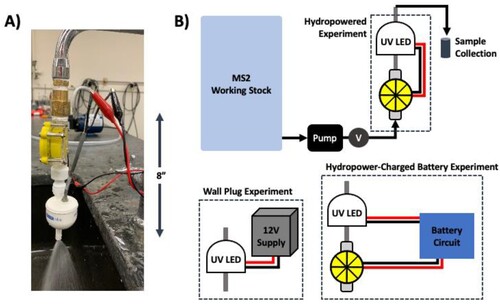
Figure 3. Flow through disinfection testing results for MS2 under three different power sources using 3 different UV LED units (3B, 6B and 9C with peak nominal wavelengths of 280 nm). The three different power sources were: wall-plug, hydropower (HP), and hydropower charged battery (HPB). Reduction equivalent doses (RED) for 254 nm (blue) and 285 nm (purple) are shown on the secondary y-axes.
Figure 4. Effect of turbine efficiency on predicted power generation () from water supplies for different flow rates (up to 4500 gal min−1 calculated; 0.284 m3 s−1) and pressure drops.
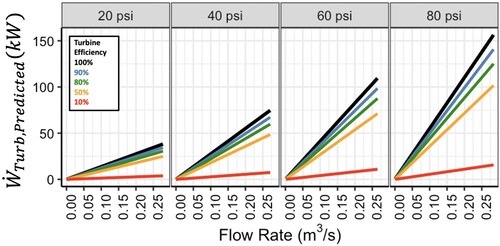
Figure 5. Effect of germicidal and hydraulic efficiency on Theoretical Minimum Required Power () for UV systems for different UV doses and water qualities (i.e. UVT) across various flow rates (up to 0.284 m3 s−1 or 4500 GPM). The solid lines, dashed line, and dotted lines represent minimum power a hypothetical system with combined 95%, 90%, and 80% germicidal and hydraulic efficiencies (
), respectively. Note that the y-axes ranges are different to permit visualisation of each data series per row. Figure S7 shows the theoretical minimum required power of UV systems for flow rates <50 GPM (<0.00315 m3 s−1).
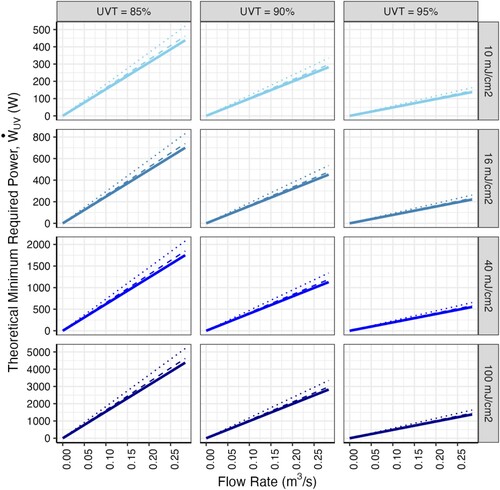
Figure 6. Design envelope for theoretical maximum turbine hydropower generation (upper bounds represented by multi-colour solid and dashed lines) and minimum theoretical required power (lower bound represented by bold solid line) for UV systems to achieve 40 mJ/cm2 under various water qualities. The theoretical maximum turbine hydropower generation was calculated assuming either 10% (dashed lines) or 100% (solid line) turbine efficiency to represent a range of turbine systems. Water qualities were represented by UV Transmittance (UVT) values 85%, 90%, and 95%.
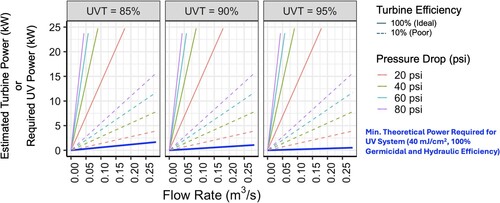
Figure 7. UV and pico-hydro turbine database (as of January 2024) where UV doses, flow rates, and power requirements were obtained from manufacturer datasheets for UV LED (blue squares) and low-pressure (LP) mercury disinfection systems (blue circles). The purple dashed line indicates the minimum power output for the smallest adequately characterised in-line turbine system commercially available in the market (Canyon Hydro MH-300-60). Compatible UV systems (i.e. within operating range specified by manufacturers to achieve the reported UV dose) for this turbine are shown as filled symbols.
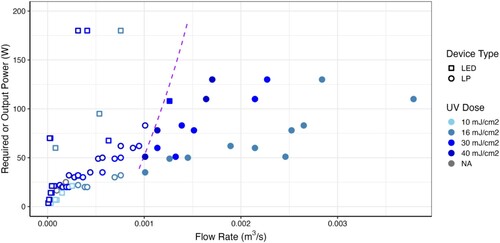
Table 1. Assumptions for economic analysis of POU hydropower UV LED system to produce potable water only for drinking and cooking requirements in an average household of 4 people.
HydropowerUV_SI_RevisionsMay2024.docx
Download MS Word (1.5 MB)Data availability statement
Data are available upon reasonable request from the authors.