
Figures & data
Figure 1. Retail employment in Örebro by SAMS areas in 2011 and the selected shopping areas for the analysis in the study.
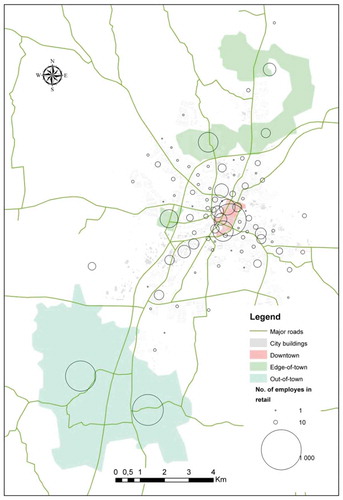
Table 1. Workforce characteristics in the three shopping locations in Örebro city in 2011. Source: statistics Sweden.
Table 2. Descriptive statistics of variables included in the GLM analysis of labour turnover 2004 to 2008. Source: statistics Sweden.
Figure 2. Replacement LTO and Crude LTO for retail workplaces in selected shopping areas in Örebro municipality in 2010–2011.
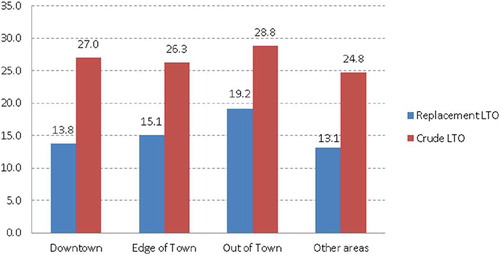
Table 3. Results from GLM models on labour turnover in the durable goods’ retail sector.