Figures & data
Table 1. Patient, tumor, and treatment characteristics at baseline.
Table 2. Associations between percentage difference and centimeter difference of all measurement points and total arm measurement.
Figure 1. Scatterplot of percentage difference of total arm volume and percentage difference at the 30-cm measurement site.
Table 3. Circumference measurements with tape measured with 10-cm distance intervals and circumference measurements of the 30-cm location, calculated as percentage difference between affected and unaffected upper extremity, at baseline before chemotherapy (T0), during chemotherapy before the second (T1) and fourth cycles (T2), and one month after completion of chemotherapy (T3).
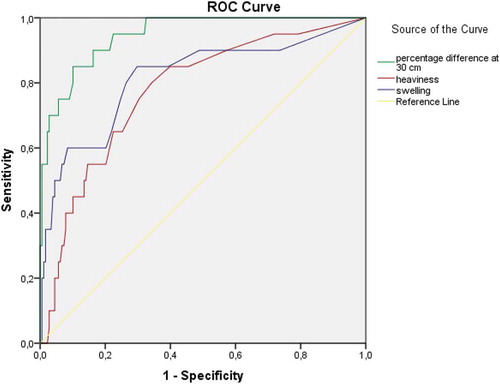
Table 4. Area under the curve (AUC) for percentage difference of a single measurement location at 30 cm proximal of the styloid process and feelings of heaviness and swelling compared to total volume, calculated with 10-cm intervals.
Figure 2. ROC curves of percentage difference between both arms at the 30-cm measurement location and heaviness and swelling in relation to lymphedema, defined as ≥10% volume difference between both arms, measured by tape with the 10-cm interval circumference measurement method.