Figures & data
Figure 1. The patient journey listed on a timeline view ordered by start of the event
Abbreviations: CT = computed tomography; HPB = hepatopancreatobiliary.
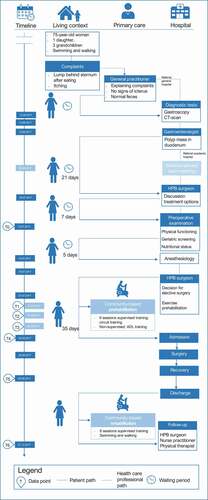
Figure 2. The step of the hypothesis-oriented-algorithm for clinicians II expanded with the international classification of functioning framework
Abbreviations: ADL = activities of daily life; COPD = chronic obstructive pulmonary disease; PPPD = pylorus-preserving pancreaticoduodenectomy; THP = total hip replacement.
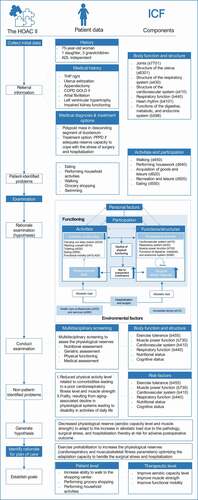
Table 1. Results of the medical, nutritional, and geriatric assessment
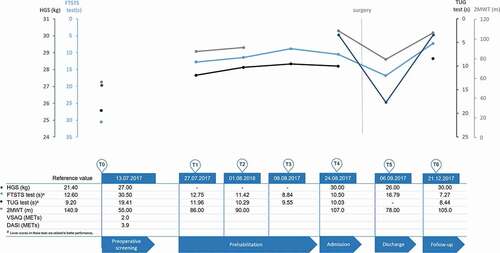
Figure 3. Results of the performance-based tests during the pre- and postoperative period
Abbreviations: DASI = Duke activity status index; FTSTS = five times sit-to-stand; HGS = handgrip strength; TUG = timed up-and-go; VSAQ = veterans-specific activity questionnaire; 2MWT = two-minute walk test.