Figures & data
Table 1. Characteristics of the participants (n = 24).
Table 2. Interview guide.
Table 3. Description of the data analysis.
Table 4. Examples of meaning units and codes underlying subcategories and categories.
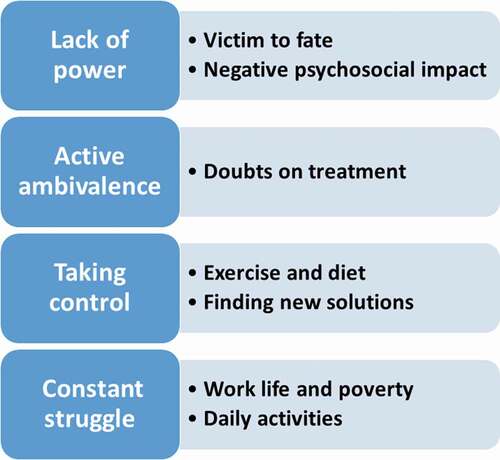
Figure 1. Approaches to osteoarthritis among patients in a rural setting in central western India.