Figures & data
Figure 1. ActivPAL and Fitbit Charge 2.
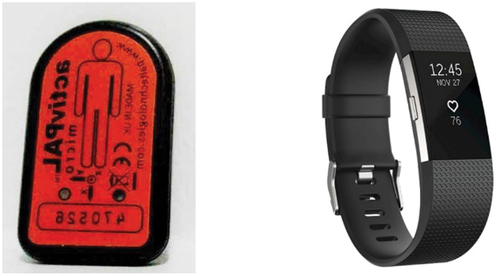
Table 1. Overall % difference for ActivPAL and Fitbit Charge 2 across treadmill walking speeds and self-selected walking speeds.
Table 2. Summary of ActivPAL, Fitbit Charge 2 and Observer Count for steps across all speeds.
Table 3. Mean Absolute Difference and % difference in steps between ActivPAL and Fitbit Charge 2 when compared to observer step count – treadmill walking and self-selected speeds.
Table 4. Pearson correlation co-efficients for the AP with the FC2 when compared to observer step count for both treadmill walking and self-selected speeds (r and p values).
Figure 2. Bland Altman plot comparing average steps for the Observer step count and ActivPAL at 2mph. Solid line indicates the mean difference between the two measures, dashed lines indicate the limits of agreement (1.96 SDs of the mean difference).
Figure 3. Bland Altman plot comparing average steps for the Observer step count and Fitbit at 2mph. Solid line indicates the mean difference between the two measures, dashed lines indicate the limits of agreement (1.96 SDs of the mean difference).