Figures & data
Table 1. Characteristics of the participants.
Table 2. Intra- and inter-rater reliability results of PPT algometry in persons with KOA.
Figure 1. Level of agreement between rater A’s 2. and 3. measurements.
Note. The values are Newton. The thick horizontal solid line represents the mean difference and the dotted horizontal lines represent the 95% limits of agreement; PPT = Pain Pressure Threshold.
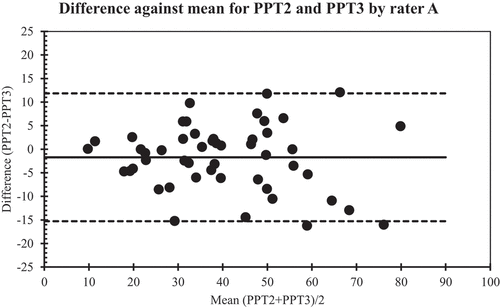
Figure 2. Level of agreement between rater B’s 2. and 3. measurements.
Note. The values are Newton. The thick horizontal solid line represents the mean difference and the dotted horizontal lines represent the 95% limits of agreement; PPT = Pain Pressure Threshold.
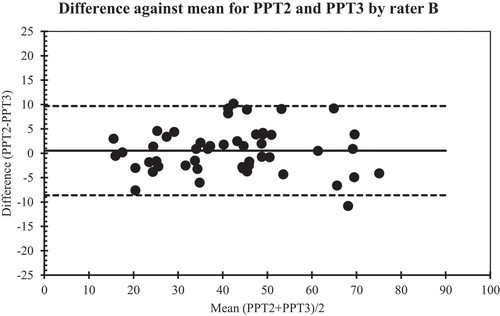
Figure 3. Level of agreement between rater C’s 2. and 3. measurements.
Note. The values are Newton. The thick horizontal solid line represents the mean difference and the dotted horizontal lines represent the 95% limits of agreement; PPT = Pain Pressure Threshold.
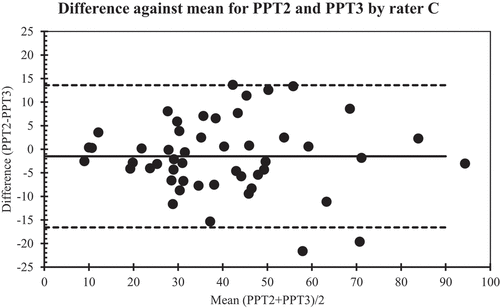
Figure 4. Level of agreement between rater A’s and B’s 2.-3. measurements.
Note. The values are Newton. The thick horizontal solid line represents the mean difference and the dotted horizontal lines represent the 95% limits of agreement; PPT = Pain Pressure Threshold.
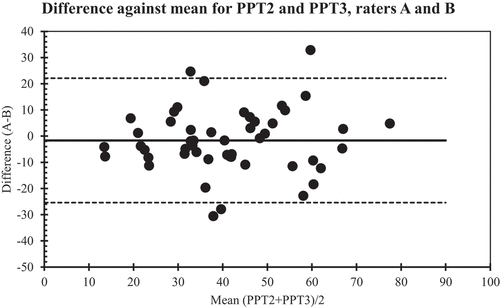
Figure 5. Level of agreement between rater A’s and C’s 2.-3. measurements.
Note. The values are Newton. The thick horizontal solid line represents the mean difference and the dotted horizontal lines represent the 95% limits of agreement; PPT = Pain Pressure Threshold.
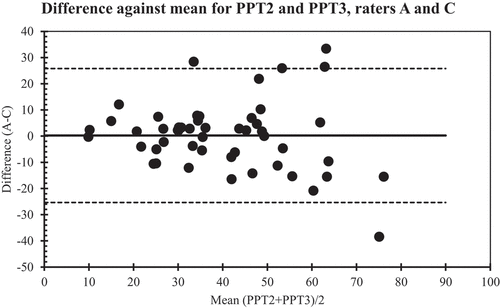
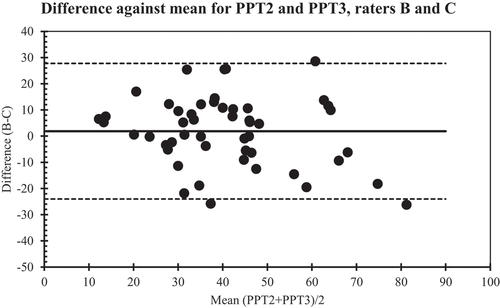
Figure 6. Level of agreement between rater B’s and C’s 2.-3. measurements.
Note. The values are Newton. The thick horizontal solid line represents the mean difference and the dotted horizontal lines represent the 95% limits of agreement; PPT = Pain Pressure Threshold.