
Figures & data
Table 1. Descriptive statistics for child participants.
Table 2. Significant results of likelihood ratios for linear mixed effects models.
Figure 1 a. The violin plots above depict the distribution of PEDI-CAT scaled scores for Mobility and Daily Activities domains for all participants (N = 34), cerebral palsy subset (n = 10), and autism subset (n = 9). Assessment 1 and 2 refer to T1 and T2. Solid circles represent group means, and open circles represent individuals’ scores. A wider violin corresponds to a greater density of scores.
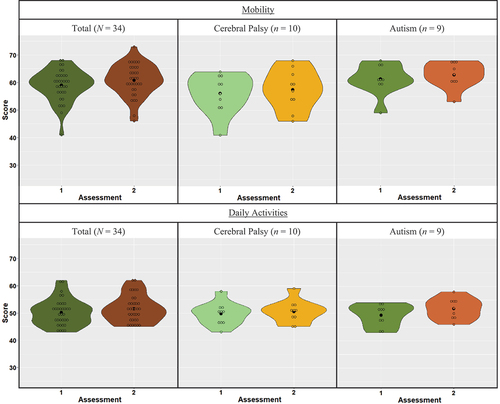
Figure 1 b. The violin plots above depict the distribution of PEDI-CAT scaled scores for the Social Cognitive domain for all participants (N = 34), cerebral palsy subset (n = 10), and autism subset (n = 9) and Responsibility domain for all participants 3 years of age or older (N = 23), cerebral palsy subset (n = 7), and autism subset (n = 6). Assessment 1 and 2 refer to T1 and T2. Solid circles represent group means, and open circles represent individuals’ scores. A wider violin corresponds to a greater density of scores.
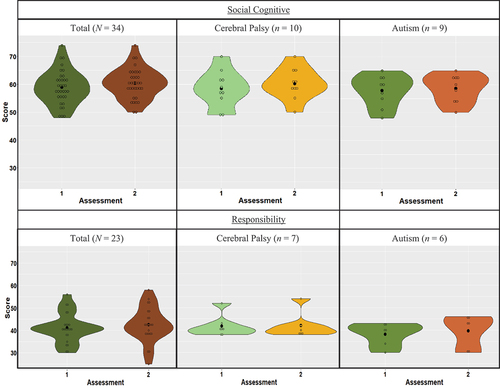
Table 3. PEDI-CAT scaled scores for time 1 and time 2.