
Figures & data
Table 1. Participant characteristics.
Table 2. Average percentage of the time observed per behavioral map item.
Figure 1. Patterns of key observed items throughout the day. 1a. Pattern throughout the day of the proportion of patients observed in their room. 1b. Patterns throughout the day of the proportion of patients spending their time lying, sitting or moving. 1c. Patterns throughout the day of the proportion of patients observed in direct contact with a nurse, therapist or family/visitors. 1d. Patterns throughout the day of the proportion of patients observed relaxing, talking, sleeping or performing exercise.
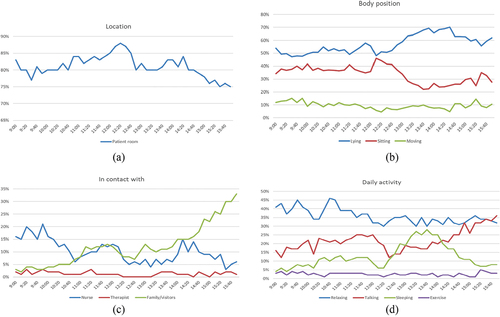
Table 3. Associations between proportion of time spent lying in bed and factors of interest*.