Figures & data
Table 1. Demographic data of participants split by personal belief on KT.
Figure 1. Effect of KT tension on muscle endurance performance in participants with extremely positive (+ belief) and extremely negative personal belief on KT (- belief).
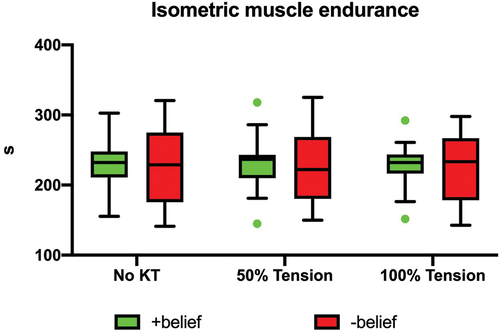
Table 2. Mean and 95% confidence intervals of dependent variables in relation to personal belief and tape tension.
Figure 2. Effect of KT tension on EMG activity in participants with extremely positive (+ belief) and extremely negative personal belief on KT (- belief).
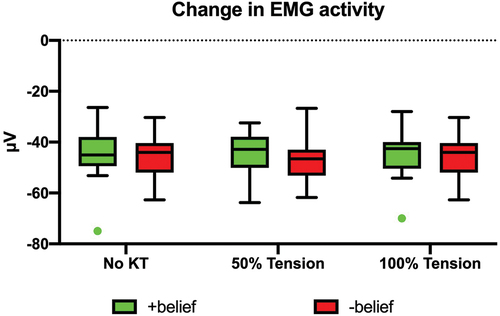
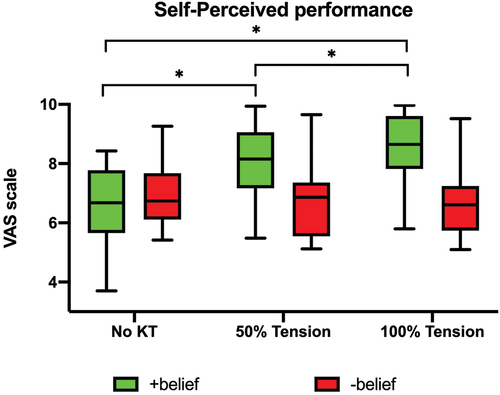
Figure 3. Effect of KT tension on self-perceived performance in participants with extremely positive (+ belief) and extremely negative personal belief on KT (- belief).