
Figures & data
Table 1. Demographics of interviewed physical therapists from the care-as-usual and MOTIFS conditions.
Figure 1. Participant flow diagram. *Approached physical therapists pre-screened for eligibility § n=2 interviews not included in analysis due to reaching data saturation MOTIFS = MOT or Imagery to Facilitate Sensorimotor re-learning.
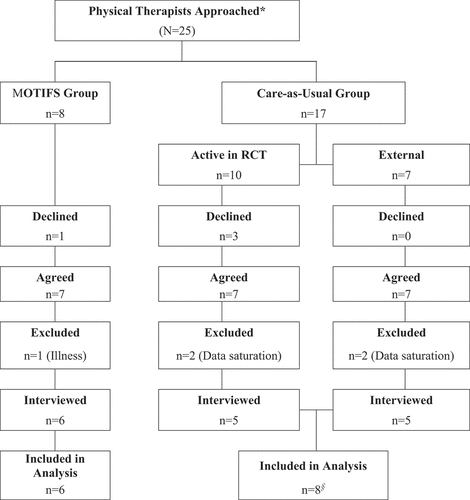
Figure 2. Major Theme regarding physical therapists’ perceptions of rehabilitation training, along with more detailed subordinate themes.
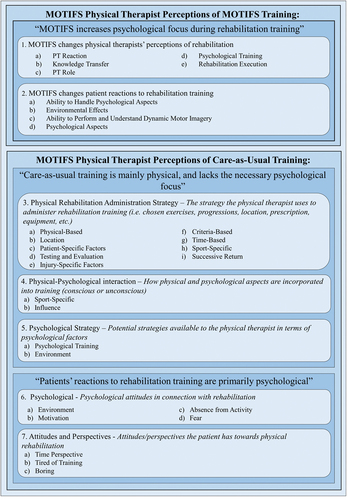
Figure 3. Major theme regarding care-as-usual physical therapists’ perceptions of rehabilitation training and more detailed subordinate themes.
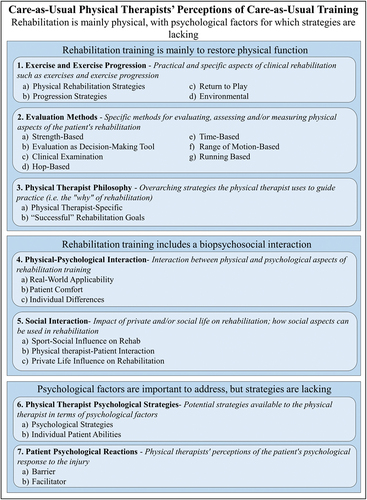
Table A1. Coding comparison analysis progression through versions of the generated conceptual models.
Table A2. Description of data collection and analysis process, including Coder roles and involvement.