Figures & data
Table 1. Participant characteristics.
Table 2. Steps of the phenomenographic analysis (Larsson and Holmström, Citation2007).
Figure 1. The outcome space.

Table 3. Descriptive categories.
Table A1. Data analysis example from participant 2. Exploring what was the focus of their attention and how they described it (analysis steps 2 and 3).
Table A2. Initial descriptions of understanding from meaning units for participant 2 (analysis step 4).
Table A3. Data analysis compiling quotes across participants. Example of category of descriptions of the Lone Ranger (analysis step 4).
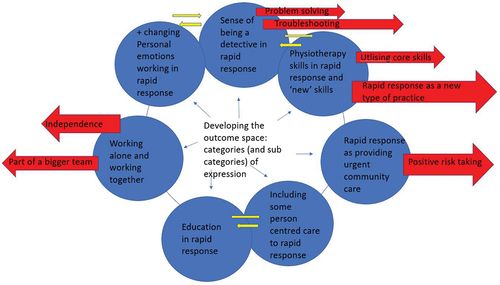
Figure A1. Early development the metaphors and outcome space.
This figure represents an early development of the metaphors and outcome space. The final outcome space ( in the main article) was refined by moving backward and forward between the quotes in each category of description, mind maps, and diagrams and with dialogic discussion between the authors (analysis steps 5 and 6).