
Figures & data
Figure 1. Status of reliability research of remote fall risk assessment in older adults.
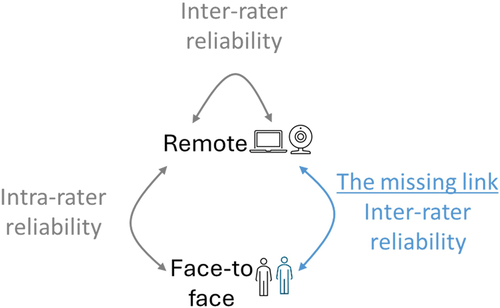
Figure 2. Testing setup of concurrent assessments in remote and face-to-face.
The assessment hall (12 × 6 meters) was divided into two areas. The balance testing area included a computer and camera positioned in front of the participant and used in the 30 second sit to stand test, Berg balance test, and the relevant tasks of the MiniBESTest. The walking testing area included a computer for remote communication with the remote physiotherapist and a wide angled camera positioned at the end of the 8-m line, which was marked on the floor. The latter setup was used for the MiniBESTest dynamic gait tasks and the 4-m walk test. Equipment used for balance assessments included a stopwatch, two chairs, a foam pad, a foam wedge, a 23-cm high box, a 20-cm high stool, a ruler, and a shoe.
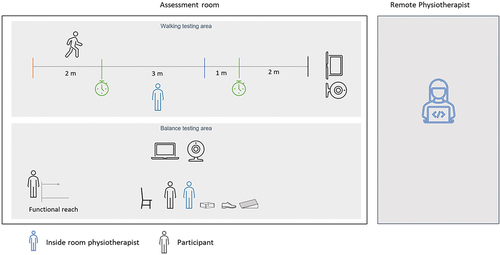
Table 1. Characteristics of the study population.
Table 2. Physical test results measured in remote and face-to-face settings, and their interclass correlation (N = 48).
Figure 3. Bland and Altman plots.
Bland and Altman plots present the agreement between remote and face-to-face (FTF) methods for the five physical tests: (a) 30 second Sit to Stand, (b) MiniBESTest, (c) Timed Up and Go, (d) 4 Meter Walk Test and (e)Berg Balance Scale. The Y-axis shows the difference between the two paired measurements (remote – FTF) and the X-axis represents the average of these measures ((remote + FTF)/2). The mean difference between remote and FTF tests is marked with a horizontal red line, the surrounding gray area represents the 95% confidence interval of the mean difference. The upper and lower actual limits of agreement (mean ±1.96 SD) are marked with black dashed lines. The predefined upper and lower limits of agreement (mean ± MDC) are marked with green lines. The fall risk cutoff is marked with vertical dashdotted blue line. Red star represents False Negative – subjects that were identified as “not at risk” in the remote assessment opposed to “at fall risk” in the FTF assessment. False Positive – subjects that were identified as “at fall risk” in the remote assessment opposed to “not at risk” in the FTF assessment are marked with green star.
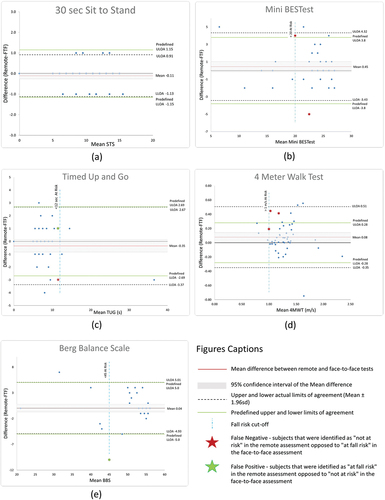
Table 3. Pearson Correlation results (r) between the five tests administered in the remote format (N = 48).