
Figures & data
Figure 1. Study area: Milieu protection areas in Berlin 2020 and heat map of available transaction data 1991–2019.
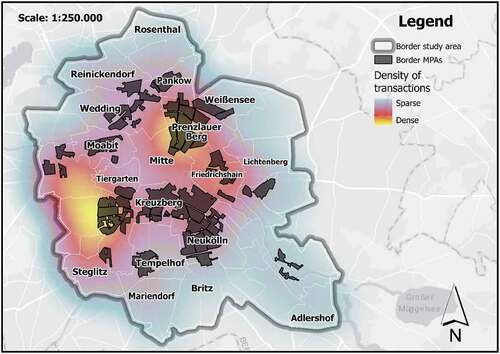
Figure 2. Number of transactions inside and outside of the MPAs 1991–2019 in the study area.
Figure 3. Change in number of transactions at block level compared to baseline in 1991 derived from the regression model.
Table 1. Parametric estimates of the overall regression DID model on the number of transactions (ln) and prices (ln).
Table 2. Selected Regression-DID estimates of MPA effect on prices and number of transactions, 1991–2019.
Figure 4. Average price inside and outside of the MPAs 1991–2019 in the study area.
Figure 5. Change in condominium prices compared to baseline in 1991 derived from the hedonic model.
Table A1. Description of the variables used in the regression DID.
Table A2. Descriptive statistics.
Table A3. Regressors of the individual local districts in the hedonic price model.