
Figures & data
Table 1. Input data for pre-lockdown period .
Table 2. Hedonic regression estimates by time period.
Figure 1. Net effect of age on the property price. Shows the effect of age in the depreciation of the property, and also shows the presence of the vintage effect.
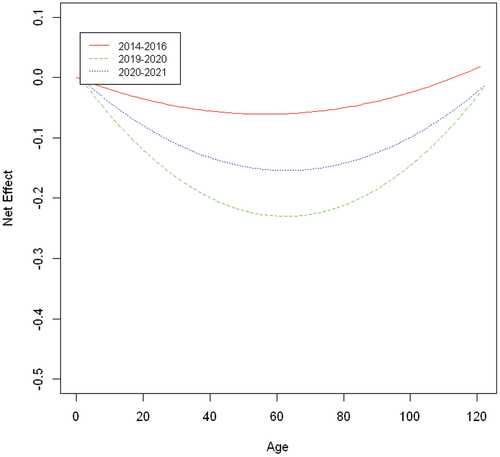
Table A1. Input data for post-lockdown period .
Table A2. Input data for 2014–2015 .
Table A3. Summary statistics of the estimates for for the pre-lockdown period.
Table A4. Summary statistics of the estimates for for the pre-lockdown period.
Figure A1. Contour plots of joint marginal distributions of with floor area and land area having random effects:
(left),
(middle),
(right) pre-lockdown.
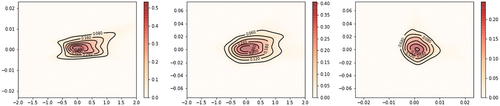
Figure A2. Contour plots of joint marginal distributions of with floor area and land area having random effects:
(left),
(middle),
(right) post-lockdown.
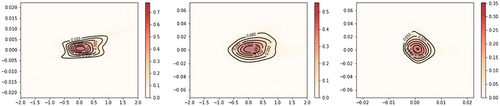
Figure A3. Contour plots of joint marginal distributions of with floor area and age at purchase having random effects:
(left),
(middle),
(right) pre-lockdown.
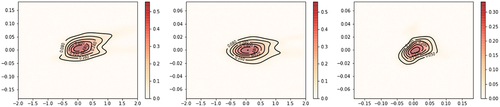
Figure A4. Contour plots of joint marginal distributions of with floor area and age at purchase having random effects:
(left),
(middle),
(right) post-lockdown.
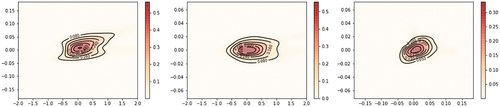
Table A5. Hedonic regression estimates by time period with quarterly time dummies.
Table A6. Summary results for OLS models using suburb in place of wards as the geographical feature.
Table A7. Contigency table for suburb and technical category for each time period.