
Figures & data
Table 1. Descriptive statistics of scraped Google Scholar profiles per geographic area.
Figure 1. Geographic overview of the scraped Google Scholar profiles.
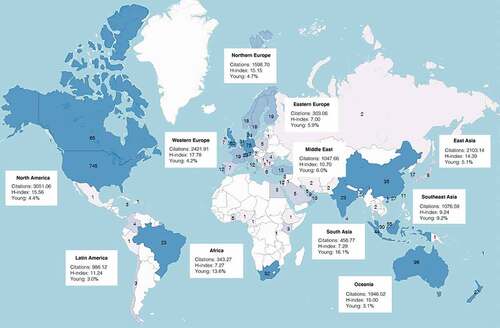
Table 2. Contrast between the adjusted predictions of citation counts and h-index; the baseline represents the citation counts or h-index of North American IS scholars.
Figure 2. Violin plot of the h-index for IS scholars in North America, Northern Europe, and Western Europe.
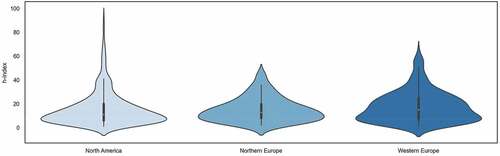
Table 3. Robust regression results.
Figure 3. Differences in government expenditure in higher education and private sector ICT investments in North America, Northern Europe, and Western Europe.
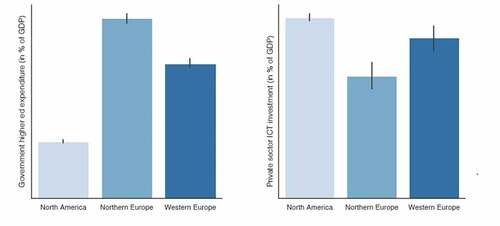
Table A1. Descriptive statistics per country.